By using this site, you agree to our Privacy Policy and our Terms of Use. Close

Forums - Sales - April 2026 Circana (NPD) Thread + Predictions

April 2025 Circana (NPD) covers the four-week period from April 5 to May 2 and will be released on May 20.

Since Circana (NPD) leaks don't happen nearly as often as it used to and hardware revenue is something we do get, be sure to include revenue in your predictions.

Feel free to also predict what you think the top software games will be for the month.

Example prediction:

[Total Hardware Revenue]

  1. [#1 selling console] XXX,000
  2. [#2 selling console] XXX,000
  3. [#3 selling console] XXX,000
  4. [#4 selling console] XXX,000

VGChartz US estimates for April 2025:

  1. PS5 - 227K
  2. XS - 118K
  3. NS - 92K

VGChartz US estimates for March 2026:

  1. NS2 - 570K
  2. PS5 - 324K
  3. XS - 80K
  4. NS - 46K

Possible impact on hardware sales:

  • PS5 - Price hike started on April 2 (Some retailers took up to two weeks to increase price)
    • PS5 DE - $500 to $600
    • PS5 Disc - $550 to $650
    • PS5 Pro - $750 to $900
  • NS2 - Continued boost from Pokémon Pokopia and Tomodachi Life: Living the Dream (NS1 BC)
  • NS1 - Tomodachi Life: Living the Dream

Current schedule for Circana (NPD):

  • Apr (Apr 5 - May 2) - May 20
  • May (May 3 - May 30) - Jun 26
  • Jun (May 31 - Jul 4) - Jul 22
  • Jul (Jul 5 - Aug 1) - Aug 19
  • Aug (Aug 2 - Aug 29) - Oct 8
  • Sep (Aug 30 - Oct 3) - Oct 22
  • Oct (Oct 4 - Oct 31) - Nov 19

RESULTS

Link to the VGChartz article here.

Switch 2 Best-Seller in the US in April 2026, Tomodachi Life Debuts in 1st

The Nintendo Switch 2 was the best-selling console in the US for April 2026 in terms of units sold and dollar sales, according to figures from Circana (formerly The NPD Group). Circana includes the dates for the four-week period of April 5 to May 2.

The PlayStation 5 came in second place once again in terms of units sold and dollar sales.

The PlayStation 5 in terms of dollar sales is down 30 percent year-on-year, while the Xbox Series X|S is down 43 percent, and the Switch is down 69 percent.

Lifetime sales of the Switch 2 through 11 months are currently 11 percent higher than the Switch, while the PS5 is currently tracking just two percent ahead of the PS4 after 66 months.

Overall spending on video games in April increased three percent year-on-year from $4.13 billion to $4.26 billion. Spending on video game content was up two percent from $3.77 billion to $3.84 billion, while video game hardware sales increased 34 percent from $196 million to $261 million. Spending on accessories decreased five percent from $167 million to $159 million.

In terms of 2026 total sales, overall spending on video games is up five percent year-on-year from $17.96 billion to $18.82 billion. Spending on video game content increased three percent from $16.17 billion to $16.67 billion, while video game hardware sales grew 37 percent from $0.97 billion to $1.34 billion. Spending on accessories is down one percent from $821 million to $811 million.

"US Video Game Spending Grows 3% in April 2026, Led by Tomodachi Life: Living the Dream," said Circana Executive Director and Video Game Industry Analyst Mat Piscatella.

He added, "US video game spending totaled $4.3B in April 2026, growing 3% when compared to a year ago. Year-to-date 2026 spending finished the month 5% higher than 2025, at $18.8B. Gains across content and hardware offset declines in accessories."

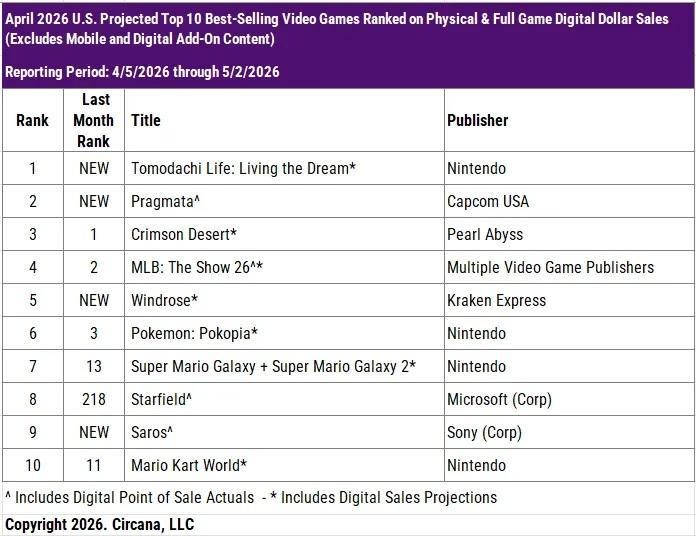
Tomodachi Life: Living the Dream was the best-selling game in US in April 2026 with it delivering over $41 million in physical and projected digital spending. It debuted as the ninth best-selling game of 2026 year-to-date.

The game helped drive new physical game sales up 44 percent year-on-year to $96 million. Spending on new physical games in 2026 year-to-date are up nine percent.

Pragmata debuted in second place for the month of April. It was also the best-selling game on PlayStation platforms, second on the PC aggregated storefronts chart and third on the Xbox charts. It was in the top 15 best-sellers on the Nintendo charts.

Windrose debuted in fifth place and Saros debuted in ninth place.

Crimson Desert and MLB: The Show 26 fell two spots to third and fourth places, respectively. Pokemon: Pokopia dropped three spots to sixth place, while Super Mario Galaxy 1 + 2 is up six spots to seventh place.

The release of the PS5 version drove Starfield sales up from 218th to eighth place. Mario Kart World rounds out the top 10.

Here are the top 20 best-selling games in terms of dollars for April 2026:

Here are the top 20 best-selling games in 2026 year-to-date:

Last edited by trunkswd - on 20 May 2026

VGChartz Sales Analyst and Writer - William D'Angelo - I stream on Twitch and have my own YouTube channel discussing gaming sales and news, as well as posting random gaming content. Follow me on Bluesky.

I post and adjust the VGChartz hardware estimates, with help from Machina.

Writer of the Sales Comparison | Monthly Hardware Breakdown Monthly Sales Analysis | Marketshare Features, as well as daily news on the Video Game Industry.

Around the Network

  • NS2 - 500K
  • PS5 - 180K
  • XS - 90K
  • NS - 40K

Last edited by XtremeBG - on 16 May 2026

My primary threads:

Ultimate Showdowns: JP 2023 / JP 2024 / JP 2025 / JP 2026 / 2026 / 2025 / 2024 / 2023 / 20222021

Lifetime Showdowns: Global / Regional / Historical / YOY Charts / 150M+ Club Chart

PS5 vs SW2 in 2026Biggest months, years and holidays / When will the Switch pass 160M? / LT expectations of: Switch / PS5 / XBSX / Switch 2

NS2 - 450k
PS5 - 380k
XS - 80k
NS - 40k


NS2 - 265K
PS5 - 195K
XS - 70K
NS - 30K


NS2 - 480k
PS5 - 360k
XS - 70k
NS - 40k


Around the Network

Circana's Mat Piscatella: "Recent price increases on other consoles have, well, let's just say they have not been warmly embraced by consumers."

This suggests PS5 sales have dropped by a decent amount in the US since the price increase. Though, April sales might be okay as retailers took up to 2 weeks into the month to increase the price.

https://bsky.app/profile/did:plc:bhqrrxt7yyfpwguioa7rwa7x/post/3ml6xxv65nc2c

Recent price increases on other consoles have, well, let's just say they have not been warmly embraced by consumers.


Last edited by trunkswd - on 06 May 2026

VGChartz Sales Analyst and Writer - William D'Angelo - I stream on Twitch and have my own YouTube channel discussing gaming sales and news, as well as posting random gaming content. Follow me on Bluesky.

I post and adjust the VGChartz hardware estimates, with help from Machina.

Writer of the Sales Comparison | Monthly Hardware Breakdown Monthly Sales Analysis | Marketshare Features, as well as daily news on the Video Game Industry.

From the theGameBusiness.com:

The US video games chart company is changing how it’s doing its monthly charts and will now include projected digital sales figures.

The current chart from Circana covers all physical games, plus digital games data supplied by publishers. But not all publishers share their download data, which means certain titles are missed, or only physical sales are counted.

Speaking to The Game Business, Circana’s games boss Mat Piscatella says that from next month they’ll be running a chart that will look to cover the whole market. The company believes it can accurately estimate how certain games are selling based on the data it receives.

“We’ve been doing these the best-selling titles charts forever,” Piscatella told us. “We’re going to be moving towards a projected total market number for those top titles starting next month. So, no asterisks and dots around physical-only or whatever. We’ll be moving towards a complete projected list. Hopefully people will get a more accurate picture of what’s selling out here in the old US of A.”

Piscatella has already posted how the charts might differ. For March 2026, MLB: The Show 26 was the No.1 game according to Circana’s initial chart, but under its new projected model, Crimson Desert would have been No.1. Slay The Spire 2 would have also made the chart at No.7, and Pokémon Pokopia would have charted higher at No.3.

The chage starts with April numbers.


I don't like the change because I don't want projected sales. I want sales. Or I would rather just have a purely physical chart. Without knowing what the projections are based on, how do we know what we are getting is accurate? Also, they should identify the games that they are projecting sales for so we know which are real and which are estimates. it reduces the validity of the information.


CosmicSex said:

I don't like the change because I don't want projected sales. I want sales. Or I would rather just have a purely physical chart. Without knowing what the projections are based on, how do we know what we are getting is accurate? Also, they should identify the games that they are projecting sales for so we know which are real and which are estimates. it reduces the validity of the information.

I'm on the fence depending on how accurate their projects are. This mainly applies to Nintendo games. I'd be all for a physical only chart and a chart that includes projected digital sales.


VGChartz Sales Analyst and Writer - William D'Angelo - I stream on Twitch and have my own YouTube channel discussing gaming sales and news, as well as posting random gaming content. Follow me on Bluesky.

I post and adjust the VGChartz hardware estimates, with help from Machina.

Writer of the Sales Comparison | Monthly Hardware Breakdown Monthly Sales Analysis | Marketshare Features, as well as daily news on the Video Game Industry.

5 days left! 


VGChartz Sales Analyst and Writer - William D'Angelo - I stream on Twitch and have my own YouTube channel discussing gaming sales and news, as well as posting random gaming content. Follow me on Bluesky.

I post and adjust the VGChartz hardware estimates, with help from Machina.

Writer of the Sales Comparison | Monthly Hardware Breakdown Monthly Sales Analysis | Marketshare Features, as well as daily news on the Video Game Industry.