By using this site, you agree to our Privacy Policy and our Terms of Use. Close

Forums - Sales Discussion - October 2023 VGChartz Estimates Thread - Worldwide Estimates Out Now

Europe Hardware Estimates for October 2023

Link to VGChartz article here.

PS5 Best-Seller, NS and XS Sales Drop - Europe Hardware Estimates for October 2023

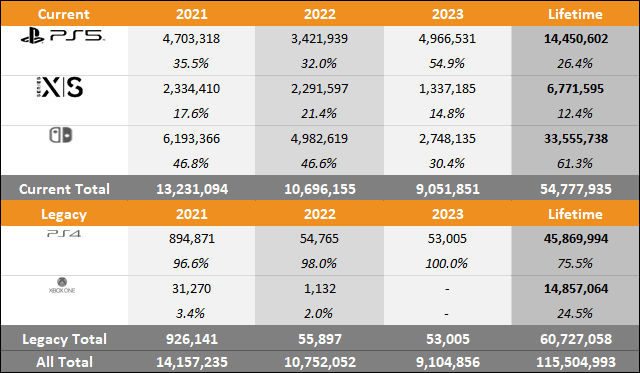
The PlayStation 5 was the best-selling console in Europe with 621,337 units sold for October 2023, according to VGChartz estimates. The PlayStation 5 has now sold an estimated 14.45 million units lifetime in Europe.

The Nintendo Switch sold an estimated 223,760 units to bring its lifetime sales to 33.56 million units. The Xbox Series X|S sold 126,939 units to bring their lifetime sales to 6.77 million units. The PlayStation 4 sold an estimated 4,265 units to bring its lifetime sales to 45.87 million units.

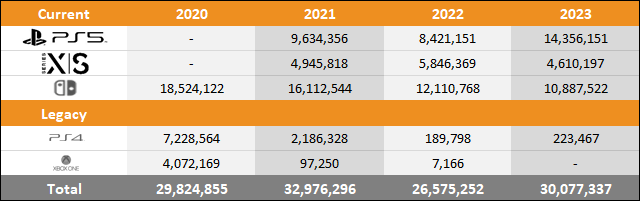
PS5 sales compared to the same month for the PS4 in 2016 are up by nearly 30,000 units, while the Xbox Series X|S compared to the same month for the Xbox One are down by nearly 111,000 units. PS4 sold 591,734 units for the month of October 2016 and Xbox One sales were at 237,607 units.

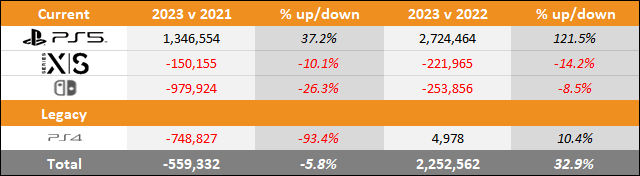
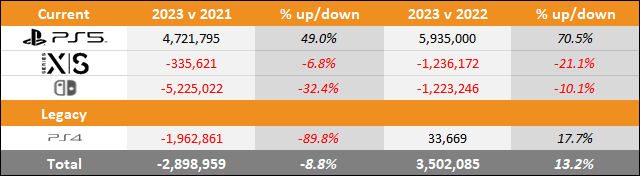
PlayStation 5 sales compared to the same month a year ago are up by 316,140 (103.6%). Xbox Series X|S sales are down by 69,666 units (-35.4%) and Nintendo Switch sales are down by 74,177 units (-24.9). The PlayStation 4 is up by 3,142 units (279.8%) year-over-year.

Looking at sales month-on-month, PlayStation 5 sales are down by over 22,000 units, Xbox Series X|S sales are own by nearly 69,000 units, and Nintendo Switch sales are down by less than 1,000 units. It should be noted there are four weeks in October, while there were five weeks in September.

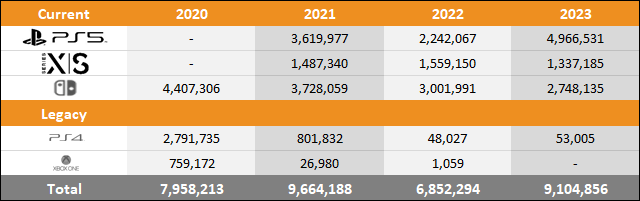
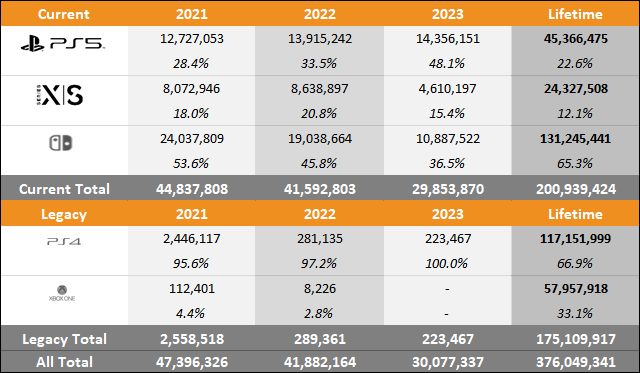
2023 year-to-date, the PlayStation 5 has sold an estimated 4.97 million units, the Nintendo Switch has sold 2.75 million units, and the Xbox Series X|S has sold 1.34 million units.

Monthly Sales:

Europe hardware estimates for October 2023 (Followed by lifetime sales):

  1. PlayStation 5 - 621,337 (14,450,602)
  2. Switch - 223,760 (33,555,738)
  3. Xbox Series X|S - 126,939 (6,771,595)
  4. PlayStation 4 - 4,265 (45,869,994)

Weekly Sales:

Europe October 7, 2023 hardware estimates:

  1. PlayStation 5 - 140,952
  2. Switch - 48,530
  3. Xbox Series X|S - 35,252
  4. PlayStation 4 - 1,161

Europe October 14, 2023 hardware estimates:

  1. PlayStation 5 - 154,924
  2. Switch - 50,784
  3. Xbox Series X|S - 29,884
  4. PlayStation 4 - 1,096

Europe October 21, 2023 hardware estimates:

  1. PlayStation 5 - 170,095
  2. Switch - 62,346
  3. Xbox Series X|S - 30,143
  4. PlayStation 4 - 1,021

Europe October 28, 2023 hardware estimates:

  1. PlayStation 5 - 155,366
  2. Switch - 62,100
  3. Xbox Series X|S - 31,660
  4. PlayStation 4 - 987


VGChartz Sales Analyst and Writer - William D'Angelo - I stream on Twitch and have my own YouTubeFollow me on Twitter @TrunksWD.

Writer of the Sales Comparison | Weekly Hardware Breakdown Top 10 | Weekly Sales Analysis | Marketshare Features, as well as daily news on the Video Game Industry.

Around the Network

5 to 1


Playstation 5 - 621,337
Everything else - 354.964

Playstation dominance in Europe is insane.


The system can get close to 2 million units in November which would be Insane.


Alex_The_Hedgehog said:

Playstation 5 - 621,337
Everything else - 354.964

Playstation dominance in Europe is insane.

Europe is known for being PlayStation land, but even so when I ran the numbers I was shocked at how far ahead the PS5 is compared to everything else. 


VGChartz Sales Analyst and Writer - William D'Angelo - I stream on Twitch and have my own YouTubeFollow me on Twitter @TrunksWD.

Writer of the Sales Comparison | Weekly Hardware Breakdown Top 10 | Weekly Sales Analysis | Marketshare Features, as well as daily news on the Video Game Industry.

Around the Network

Link to VGChartz article here.

PS5 vs Xbox Series X|S vs Switch 2023 Europe Sales Comparison Charts Through October

Here we see data representing the sales through to consumers and change in sales performance of the three current platforms (PlayStation 5, Xbox Series X|S, and Nintendo Switch) and two legacy platforms (PlayStation 4 and Xbox One) over comparable periods for 2020, 2021, 2022, and 2023. Also shown is the market share for each of the consoles over the same periods.

Year to Date Sales Comparison (Same Periods Covered)

Market Share (Same Periods Covered)

2020 – (January 2020 to October 2020)

2021 – (January 2021 to October 2021)

2022 – (January 2022 to October 2022)

2023 – (January 2023 to October 2023)

"Year to date" sales for 2020, 2021, 2022, and 2023 sales are shown in series at the top of the table and then just below a comparison of 2023 versus 2022 and 2023 versus 2021 is displayed.  This provides an easy-to-view summary of all the data.

Total Sales and Market Share for Each Year

Microsoft

  • Xbox Series X|S
    • 1.34 million units sold year-to-date
    • Down year-on-year 221,965 units (-14.2%)

Nintendo

  • Nintendo Switch
    • 2.75 million units sold year-to-date
    • Down year-on-year 252,856 units (-8.5%)

Sony

  • PlayStation 5
    • 4.97 million units sold year-to-date
    • Up year-on-year 2,724,464 units (121.5%)
  • PlayStation 4
    • 0.05 million units sold year-to-date
    • Up year-on-year 4,978 (10.4%)


VGChartz Sales Analyst and Writer - William D'Angelo - I stream on Twitch and have my own YouTubeFollow me on Twitter @TrunksWD.

Writer of the Sales Comparison | Weekly Hardware Breakdown Top 10 | Weekly Sales Analysis | Marketshare Features, as well as daily news on the Video Game Industry.

Worldwide Hardware Estimates for October 2023

Link to VGChartz article here.

PS5 Sells Over 1.2M, XS Tops 24M Lifetime - Worldwide Hardware Estimates for October 2023

The PlayStation 5 was the best-selling console worldwide with 1,228,434 units sold for October 2023, according to VGChartz estimates. The PlayStation 5 has now sold an estimated 45.37 million units lifetime worldwide.

The Nintendo Switch sold an estimated 868,471 units to bring its lifetime sales to 131.25 million units. The Xbox Series X|S sold 412,119 units to bring their lifetime sales to 24.33 million units. The PlayStation 4 sold an estimated 19,137 units to bring its lifetime sales to 117.15 million units.

PS5 sales compared to the same month for the PS4 in 2016 are down by nearly 80,000 units, while the Xbox Series X|S compared to the same month for the Xbox One are down by nearly 393,000 units. PS4 sold 1,308,030 units for the month of October 2016 and Xbox One sales were at 804,748 units.

PlayStation 5 sales compared to the same month a year ago are up by 112,520 (10.1%). Xbox Series X|S sales are down by 135,268 units (-24.7%) and Nintendo Switch sales are down by 58,636 units (-6.3%). The PlayStation 4 is up 5,601 units (41.4%) year-over-year.

Looking at sales month-on-month, PlayStation 5 sales are down by nearly 544,000 units, Xbox Series X|S sales are down by nearly 262,000 units, and Nintendo Switch sales are down by nearly 128,000 units. It should be noted there are four weeks in October, while there were five weeks in September.

2023 year-to-date, the PlayStation 5 has sold an estimated 14.36 million units, the Nintendo Switch has sold 10.89 million units, and the Xbox Series X|S has sold 4.61 million units.

Check out the breakdown of the Americas sales here, the Europe sales here, and the Japan sales here.

Monthly Sales:

Global hardware estimates for October 2023 (Followed by lifetime sales):

  1. PlayStation 5 - 1,228,434 (45,366,475)
  2. Switch - 868,471 (131,245,441)
  3. Xbox Series X|S - 412,119 (24,327,508)
  4. PlayStation 4 - 19,137 (117,151,999)
Americas (US, Canada, Latin America) hardware estimates for October 2023:
  1. PlayStation 5 - 393,059
  2. Switch - 244,577
  3. Xbox Series X|S - 240,091
  4. PlayStation 4 - 6,160
Europe hardware estimates for October 2023:
  1. PlayStation 5 - 621,337
  2. Switch - 223,760
  3. Xbox Series X|S - 126,939
  4. PlayStation 4 - 4,265
Asia (Japan, mainland Asia, Middle East) hardware estimates for October 2023:
  1. Switch - 379,433
  2. PlayStation 5 - 181,496
  3. Xbox Series X|S - 24,899
  4. PlayStation 4 - 8,151
Oceania (Australia and New Zealand) hardware estimates for October 2023:
  1. PlayStation 5 - 32,542
  2. Switch - 20,701
  3. Xbox Series X|S - 20,190
  4. PlayStation 4 - 561

Weekly Sales:

Global October 7, 2023 hardware estimates:

  1. PlayStation 5 - 313,508
  2. Switch - 249,003
  3. Xbox Series X|S - 100,293
  4. PlayStation 4 - 4,456

Global October 14, 2023 hardware estimates:

  1. PlayStation 5 - 310,296
  2. Switch - 178,099
  3. Xbox Series X|S - 98,134
  4. PlayStation 4 - 5,772

Global October 21, 2023 hardware estimates:

  1. PlayStation 5 - 317,992
  2. Switch - 219,018
  3. Xbox Series X|S - 103,708
  4. PlayStation 4 - 4,790

Global October 28, 2023 hardware estimates:

  1. PlayStation 5 - 286,638
  2. Switch - 222,351
  3. Xbox Series X|S - 109,984
  4. PlayStation 4 - 4,119
Last edited by trunkswd - on 22 November 2023

VGChartz Sales Analyst and Writer - William D'Angelo - I stream on Twitch and have my own YouTubeFollow me on Twitter @TrunksWD.

Writer of the Sales Comparison | Weekly Hardware Breakdown Top 10 | Weekly Sales Analysis | Marketshare Features, as well as daily news on the Video Game Industry.

8.5% down YOY for Switch is admirable given its advanced age.
It more than doubled the Xbox this month despite being more than twice as old.


curl-6 said:

8.5% down YOY for Switch is admirable given its advanced age.
It more than doubled the Xbox this month despite being more than twice as old.

Outselling XBOX, even double, in the years since 2012, isn't achievement at all.


My sales comparison threads:

Ultimate Showdowns: JP 2023 / JP 2024 / 2024 / 2023 / 20222021

Lifetime Showdown / Historical Showdown / YOY Charts / 140M+ Club Chart

Link to VGChartz article here.

PS5 vs Xbox Series X|S vs Switch 2023 Worldwide Sales Comparison Charts Through October

Here we see data representing the sales through to consumers and change in sales performance of the three current platforms (PlayStation 5, Xbox Series X|S, and Nintendo Switch) and two legacy platforms (PlayStation 4 and Xbox One) over comparable periods for 2020, 2021, 2022, and 2023. Also shown is the market share for each of the consoles over the same periods.

Year to Date Sales Comparison (Same Periods Covered)

Market Share (Same Periods Covered)

2020 – (January 2020 to October 2020)

2021 – (January 2021 to October 2021)

2022 – (January 2022 to October 2022)

2023 – (January 2023 to October 2023)

"Year to date" sales for 2020, 2021, 2022, and 2023 sales are shown in series at the top of the table and then just below a comparison of 2023 versus 2022 and 2023 versus 2021 is displayed.  This provides an easy-to-view summary of all the data.

Total Sales and Market Share for Each Year

Microsoft

  • Xbox Series X|S
    • 4.61 million units sold year-to-date
    • Down year-on-year 1,236,172 units (-21.1%)

Nintendo

  • Nintendo Switch
    • 10.89 million units sold year-to-date
    • Down year-on-year 1,223,246 units (-10.1%)

Sony

  • PlayStation 5
    • 14.36 million units sold year-to-date
    • Up year-on-year 5,935,000 units (70.5%)
  • PlayStation 4
    • 0.22 million units sold year-to-date
    • Up year-on-year 33,669 (17.7%)


VGChartz Sales Analyst and Writer - William D'Angelo - I stream on Twitch and have my own YouTubeFollow me on Twitter @TrunksWD.

Writer of the Sales Comparison | Weekly Hardware Breakdown Top 10 | Weekly Sales Analysis | Marketshare Features, as well as daily news on the Video Game Industry.