Hello everyone, this is my first post, but I have been a fan of this site for over 10 years, I have always enjoyed reading all the different sales threads. Hopefully I can add something to the conversation.
In terms of this Gap Charts, I feel that the NS vs Wii will be very interesting for the next 5 months, NS should be able to sell more than the 10 million PDiddy mentioned (I added the current ~1M lead). According to the current VGChartz DB, if switch is able to replicate the December 2019-April 2020, then it would sell about 12.4 million. But this is a big challenge as march and april were incredibly high. After that, there is not much of a battle in my opinion. I think there is even a slim chance the NS reaches over 100 Million in 2021.

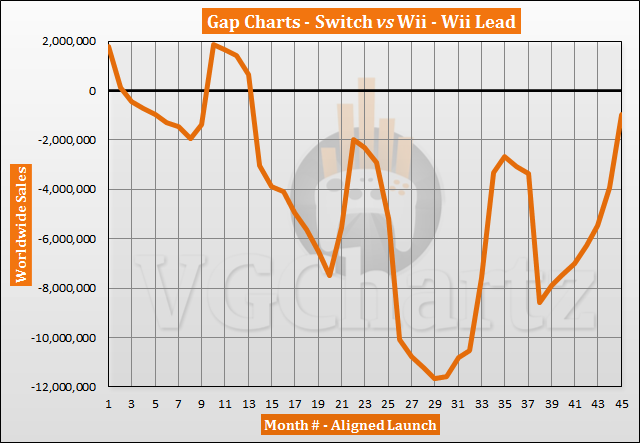
I have been working on a theory that for consoles like Switch that get launched in a different month, there could be a different type of analisis that is Month Aligned. This means that the month that is released is compared to the same month for other consoles, that way we try to prevent the double helix effect in some gap charts. If we do the Month Aligned chart for NS vs Wii, we get this chart that might be a lot more indicative of what is going on.

With this month aligned, the next month (month 46 for the NS) will compare December for both consoles, in this case the NS would have to beat the 6.5 million of the wii for its fourth christmas. I personally don't think that is possible, but the switch has surprised us a lot this year.
Hopefully this sounds like a fun idea, I will be glad to share more of these gap charts month aligned if anyone is interested. I log in constantly waiting for @trunkswd posts. Thank you Trunks for all your hard work.