By using this site, you agree to our Privacy Policy and our Terms of Use. Close

Forums - Nintendo Discussion - Nintendo quarterly results (Switch 4.8M for the quarter, 41.67 M total)

Smash is pretty much guaranteed to pass 20 million lifetime at this point, and amazingly BOTW looks to have a decent shot at doing so as well.

Very keen to see how Luigi's Mansion 3 fares; LM2 did just over 6 million on 3DS, folllowing the trend so far of software selling far better on Switch than prior platforms, could LM3 perhaps (eventually) join the 10 million plus club? I reckon it has a shot.

Last edited by curl-6 - on 01 November 2019

Around the Network
curl-6 said:

Smash is pretty much guaranteed to pass 20 million lifetime at this point, and amazingly BOTW looks to have a decent shot at doing so as well.

Very keen to see how Luigi's Mansion 3 fares; LM2 did just over 6 million on 3DS, folllowing the trend so far of software selling far better on Switch than prior platforms, could LM3 perhaps (eventually) join the 10 million plus club? I reckon it has a shot.

LM3 has a shot at 10mil. 6mil+ is the floor

As for smash, if the game sells an avg of 750k per quarter for the next 2 and a half years (this includes Holiday) that would be 23mil right there. I say 750k cuz the other quarters can do like 500k-600k each and holiday about 1mil 

Edit: Botw hasnt drop under 500k in any quarter or even close. If that does an avg of 500k per quarter for the next 3 years (even with a sequel coming), itll be over 20mil. As of now BotW on switch will be closer to 25mil then 20mil (excluding wiiu)

This is crazy and my Bold prediction seems more like a bomba in comparison lmfao


Dulfite said:
tak13 said:

Could you do the same, combining 3ds and wii u sales, please? 

I kind of thought the same, but that wouldn't reflect all the money they saved by not having two research and development teams, two sets of software teams, two sets of marketing teams, etc. They've saved a lot of money by consolidating down to one device, possibly offsetting the fact that they aren't selling as many Switch's as they would combined sales of home console and portable in most generations.

I don't think that's the right way to look at it given the Switch is a different kind of platform with different value and software sales patterns. I am not sure the average number of users per console, but it's a safe bet to consider a higher average number of users per Switch than per 3DS, which means higher software sales potential. We can back this by looking at the data, Nintendo sells way more games on Switch, and is bringing in significantly more money in the Switch era than in the Wii U/3DS era.

Last edited by Jumpin - on 02 November 2019

I describe myself as a little dose of toxic masculinity.

"Switch Lite" is not doing as good as I hoped, but lets see what it does during the holidays.


Jumpin said:
Dulfite said:

I kind of thought the same, but that wouldn't reflect all the money they saved by not having two research and development teams, two sets of software teams, two sets of marketing teams, etc. They've saved a lot of money by consolidating down to one device, possibly offsetting the fact that they aren't selling as many Switch's as they would combined sales of home console and portable in most generations.

I don't think that's the right way to look at it given the Switch is a different kind of platform with different value and software sales patterns. I am not sure the average number of users per console, but it's a safe bet to consider a higher average number of users per Switch than per 3DS, which means higher software sales potential. We can back this by looking at the data, Nintendo sells way more games on Switch, and is bringing in significantly more money in the Switch era than in the Wii U/3DS era.

Interesting chart. Is that just software sales, or hardware? And I'd be more interested in global figures than just US.

Rereading your comment I'm assuming this is just software sales? And the average they make per game is higher because they are mostly $60 to start, though their cost of development is also a higher average due to this being all HD rather than the 3DS standard definition.


Around the Network
Deeds said:

"Switch Lite" is not doing as good as I hoped, but lets see what it does during the holidays.

It will do better when they release more games that give people a purpose for having multiple devices in their homes. Animal Crossing New Horizon will help a lot. As will Pokemon.


RolStoppable said:
Dulfite said:

Interesting chart. Is that just software sales, or hardware? And I'd be more interested in global figures than just US.

Rereading your comment I'm assuming this is just software sales? And the average they make per game is higher because they are mostly $60 to start, though their cost of development is also a higher average due to this being all HD rather than the 3DS standard definition.

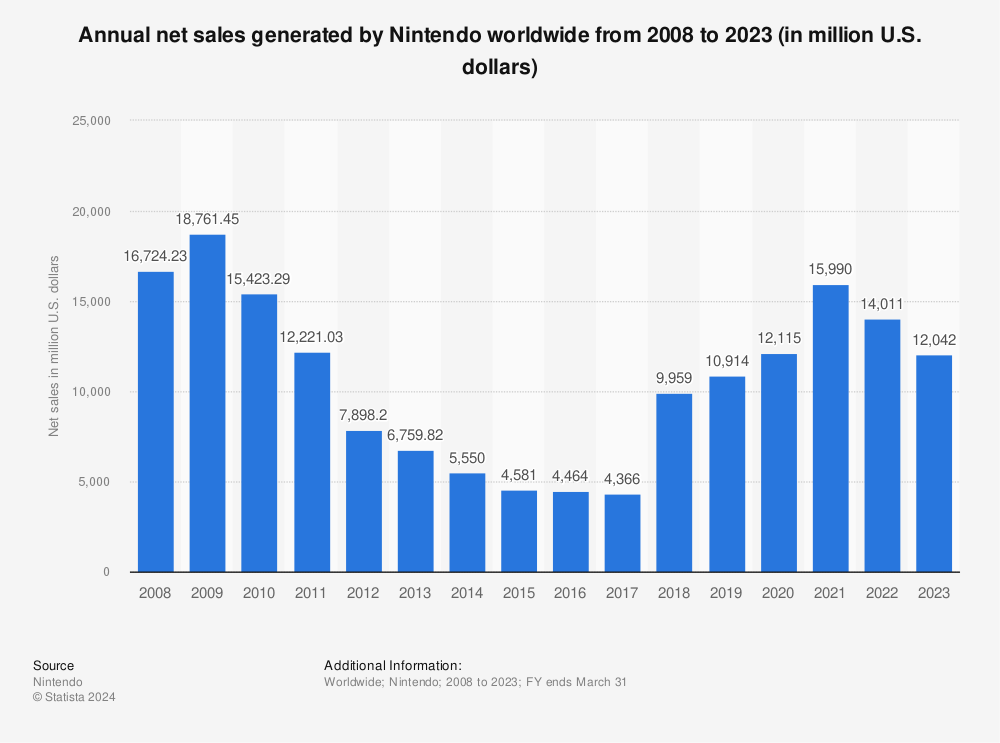
The chart displays net sales which is another term for revenue, so the total amount of money spent on Nintendo products during each year. The figures are global, the US part in the headline of the image only refers to the currency of the numbers.

What's more interesting than a chart for net sales (a.k.a. revenue) is operating profit, so the money Nintendo has earned after their costs and expenses have been substracted.

This image highlights how much better Switch is for Nintendo than the 3DS and Wii U were. The sum of the 3DS and Wii U years evens out to about zero profit; the 3DS launched at the tail end of fiscal year 2011, so the vast majority of the 2011 bar are profits generated by the Wii and DS. Fiscal year 2012 is when Nintendo had to cut the price of the 3DS early and that caused the loss; afterwards the Wii U didn't help matters.

Switch launched at the tail end of fiscal year 2017, so it was available for only one month in the 2017 period. 2018 includes Switch in earnest and that's where profits are shooting up. Basically, Switch made Nintendo more profit in its first year than the 3DS and Wii U did during their entire lifetimes. 2019 shows further growth and the current fiscal year 2020 (not on the image) will see another slight increase. While Switch won't reach the same peak as the Wii and DS combined (2008-2010), it's doing leaps and bounds better than the 3DS and Wii U to become one of the most successful consoles of all time, regardless of which metrics are used (revenue, profit, hardware units, software units, tie ratio).

I was not sure, but the 2019 quantity only shows the 2 first Q of FY2019, which means at the end that 209 will be around 3 times higher than this current graph and possibly be the best FY ever for Nintendo.

EDIT : no there is a problem in what you say, Nintendo released the Switch on the last month of FY2016, not 2017.


Amnesia said:
RolStoppable said:

The chart displays net sales which is another term for revenue, so the total amount of money spent on Nintendo products during each year. The figures are global, the US part in the headline of the image only refers to the currency of the numbers.

What's more interesting than a chart for net sales (a.k.a. revenue) is operating profit, so the money Nintendo has earned after their costs and expenses have been substracted.

This image highlights how much better Switch is for Nintendo than the 3DS and Wii U were. The sum of the 3DS and Wii U years evens out to about zero profit; the 3DS launched at the tail end of fiscal year 2011, so the vast majority of the 2011 bar are profits generated by the Wii and DS. Fiscal year 2012 is when Nintendo had to cut the price of the 3DS early and that caused the loss; afterwards the Wii U didn't help matters.

Switch launched at the tail end of fiscal year 2017, so it was available for only one month in the 2017 period. 2018 includes Switch in earnest and that's where profits are shooting up. Basically, Switch made Nintendo more profit in its first year than the 3DS and Wii U did during their entire lifetimes. 2019 shows further growth and the current fiscal year 2020 (not on the image) will see another slight increase. While Switch won't reach the same peak as the Wii and DS combined (2008-2010), it's doing leaps and bounds better than the 3DS and Wii U to become one of the most successful consoles of all time, regardless of which metrics are used (revenue, profit, hardware units, software units, tie ratio).

I was not sure, but the 2019 quantity only shows the 2 first Q of FY2019, which means at the end that 209 will be around 3 times higher than this current graph and possibly be the best FY ever for Nintendo.

EDIT : no there is a problem in what you say, Nintendo released the Switch on the last month of FY2016, not 2017.

2019 isnt just 2 quarters, its the projected total for the fiscal year.

And FY2017 is the year ending March 2017.


When the herd loses its way, the shepard must kill the bull that leads them astray.

zorg1000 said:
Amnesia said:

I was not sure, but the 2019 quantity only shows the 2 first Q of FY2019, which means at the end that 209 will be around 3 times higher than this current graph and possibly be the best FY ever for Nintendo.

EDIT : no there is a problem in what you say, Nintendo released the Switch on the last month of FY2016, not 2017.

2019 isnt just 2 quarters, its the projected total for the fiscal year.

And FY2017 is the year ending March 2017.

oh my....Ok...So all my graphs were wrong until now. But that was just a problem of labeling, my data were correct. So we are now, in the Japan FY2020 right ?


Amnesia said:

oh my....Ok...So all my graphs were wrong until now. But that was just a problem of labeling, my data were correct. So we are now, in the Japan FY2020 right ?

RolStoppable said:

Nintendo's corporate website uses the wording "fiscal term ended March XXXX", so I am not even sure anymore if the fiscal year ending March 2020 would be called FY2019 or FY2020. As long as you label your graphs unambiguously, it will be fine. Probably why it's common that the wording "fiscal year ending March" is being used because it's clearer which timeframe is meant.

The convention that Nintendo uses is for FYXXXX to refer to the fiscal year that starts in April XXXX. So FY2019 is the same as the fiscal year ending March 2020.

https://www.nintendo.co.jp/ir/en/library/earnings/index.html

However, the Business Insider chart is not using this convention: It clearly states that '2019' means the fiscal year ending March 2019. That's why it says that the 2019 forecast was made in April 2018.

Last edited by StarDoor - on 02 November 2019