Mnementh on 11 January 2013
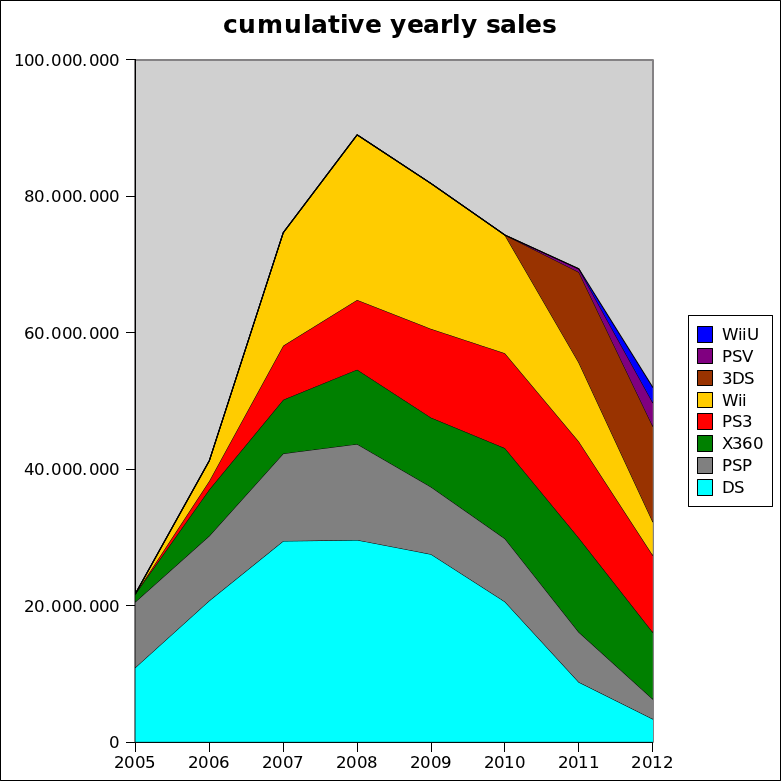
| wfz said: Very interesting to see. It would be fun if you also included a graph for "the overall console market" that aligned sales per console by year from 2005 to now. Make it an additive area chart so we can see total market sales of cumulative platforms to see the rise/fall/??? of the console market from 2005 to now. |
I don't understand really what you want.