


Mnementh on 11 January 2013
| wfz said: Oh derp, I just realized I made an error in one of my previous posts. I wanted you to label the *X* axis in years, so the graph would start in 2005 and show the console sales to now. :P So the Wii U would only show up near the end of the graph. Sales of all consoles wouldn't be launch-aligned but rather displayed on a weekly/monthly basis across years. |
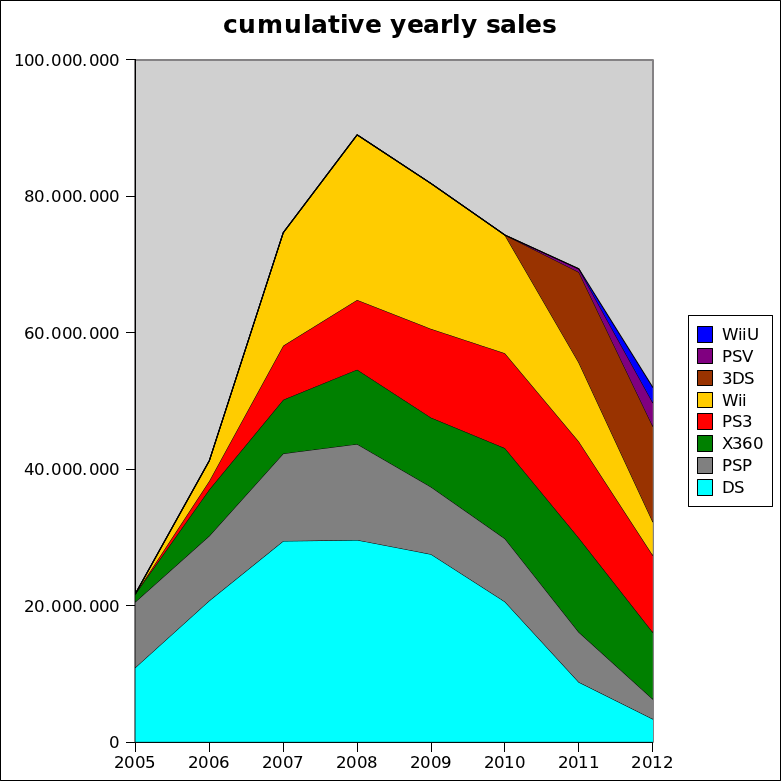
I will not do that on a weekly base - that means extracting practically all hardware-data from vgchartz. I will not do that by hand and don't feel like writing a program for that. I can do that for yearly sales though. Looks like this:
I wouldn't add this to OP though, as this will change not noticable on a weekly base. We can look at it again next year.
Edit: I realized I named this wrong, it's not cumulative. I can't think of the right name at the moment.