


Seece on 31 January 2011
I updated this and redesigned from a chart I saw on a gaming investments site, 99% sure all the figures are correct.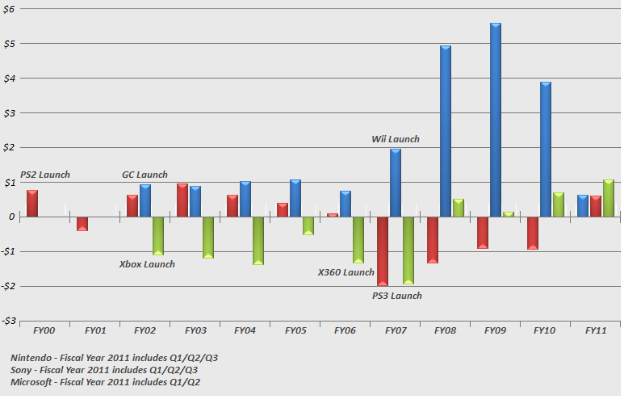
Sony and Microsoft both have other products in their division.