By using this site, you agree to our Privacy Policy and our Terms of Use. Close

Forums - Politics Discussion - Mitt Romney. 27 lies in 38 minutes.

really,a politician lying about something? news to me? hahaha. I hate romney,but I'm sure you can find just as many lies that obama told through out his time in office.


Around the Network

Not sure who wrote the nonesense in the OP but that was some pretty awful analysis.


asdc - trust me... obama prepped well enough. In fact, Gore blamed Obamas performance on prepping in Nevada instead of Colorado.


What has this world come to if democracy means choosing between a Democrat or a Republican?


I can barely stand even seeing this thread and many of the comments. It's crazy to me that ppl still are so naive/closed-minded/blind that they can think one candidate is all evil while the opposing candidate is all good.

You can really talk bad about how much Romney lied and at the same time ignore that Obama lies as well? Its politics; it happens. That's why ill never be totally convinced on a certain candidate, no matter how good they seem.

I gave Obama a fair chance as president. While I don't have disdain for him like many do, he definitely has done several things that I absolutely didnt like, and even some things that made him seem quite untrustworthy.

Am I crazy about Romney? No; but, he does have a lot of good credentials, including experience in both politics and business. An important thing about Romney though, is that he's not Obama.

Many people want Romney in office JUST b/c he's an alternative to Obama. I have to say that I feel a little bit this way as well. Some of the things Obama has done have turned me off to him, therefore making me want someone else. Although I'm not a huge fan of Romney, the difference is that he hasn't been given a chance in office yet to prove himself; Obama has.


Around the Network
HappySqurriel said:
MDMAlliance said:
All these comments about how Obama is the worst president and how people who can defend Obama are blind or whatever, and the comments about "liberals" or "democrats." You guys don't know anything, and you contribute nothing to this thread. You regurgitate what the media of your political party says, or what the people around you say. As for the Romney comments, it somewhat is the same way however it's not nearly as bad as the Obama ones.

It's strange how quick people are to claim that the job unemployment numbers and reports are BS and fixed, yet most of you saying that give no source that really shows you are correct. With all things considered in this situation, if Obama were really as bad of a president you think he is, our numbers would be significantly worse than they were when he got into office. Do you guys remember all the news reports of how high unemployment rates were? Exactly.

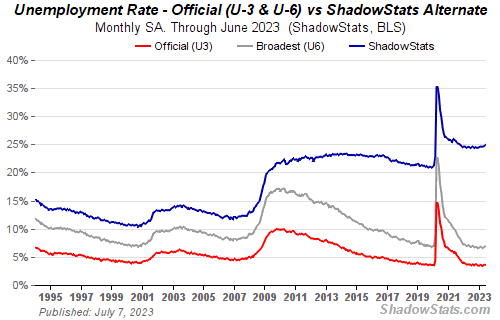
The job numbers are heavily manipulated. Over the years the methodology for calculating unemployment has changed and these changes have been to lower the labor force participation rate and therefore reduce unemployment. If we calculated unemployment without these mainpulations we would get the following:

http://www.shadowstats.com/alternate_data/unemployment-charts


As you can see, the traditional methods for calculating unemployment result in both dramatically higher unemployment rates and unemployment that has steadily increased since 2010. The primary reason for this difference is caused because, when the long term unemployed become discouraged and "give up" they are no longer seen as unemployed by the new statistics while they were based on the old methodologies.


In other words, the unemployment rate has fallen below 8% because the job market is so bad that millions of people have given up on ever finding work.

Isn't that chart showing that it's always being "manipulated" then?  There's also not very much to say that the chart is reliable.  Where does this person get his information from?  


MDM - Yes it would always be "manipulated" but that isnt the point of the chart. Look at the lines... they are pretty synced with each other. That is until 2010 the blue line goes up while the red goes down


MDMAlliance said:
HappySqurriel said:
MDMAlliance said:
All these comments about how Obama is the worst president and how people who can defend Obama are blind or whatever, and the comments about "liberals" or "democrats." You guys don't know anything, and you contribute nothing to this thread. You regurgitate what the media of your political party says, or what the people around you say. As for the Romney comments, it somewhat is the same way however it's not nearly as bad as the Obama ones.

It's strange how quick people are to claim that the job unemployment numbers and reports are BS and fixed, yet most of you saying that give no source that really shows you are correct. With all things considered in this situation, if Obama were really as bad of a president you think he is, our numbers would be significantly worse than they were when he got into office. Do you guys remember all the news reports of how high unemployment rates were? Exactly.

The job numbers are heavily manipulated. Over the years the methodology for calculating unemployment has changed and these changes have been to lower the labor force participation rate and therefore reduce unemployment. If we calculated unemployment without these mainpulations we would get the following:

http://www.shadowstats.com/alternate_data/unemployment-charts


As you can see, the traditional methods for calculating unemployment result in both dramatically higher unemployment rates and unemployment that has steadily increased since 2010. The primary reason for this difference is caused because, when the long term unemployed become discouraged and "give up" they are no longer seen as unemployed by the new statistics while they were based on the old methodologies.


In other words, the unemployment rate has fallen below 8% because the job market is so bad that millions of people have given up on ever finding work.

Isn't that chart showing that it's always being "manipulated" then?  There's also not very much to say that the chart is reliable.  Where does this person get his information from?  

All of the data used by the Bureau of Labor Statistics is publicly available, and their methodology is well documented, so he uses the data they collected and calculates the unemployment rate using their old methodology.

Now, through most of the timeframe presented by this graph the unemployment trends have been (basically) the same regardless of the methodology used; with U3 being (roughly) 4% to 5% below U6, and U6 being roughly 4% to 5% below the classical methodology. After 2009 though there is a very drastic difference in the trend being demonstrated by the two methodologies, the official statistics demonstrate a decline in unemployment of (about) 2% while the tradional method demonstrates an increase in unemployment of (about) 2%. What this means is that the number of discouraged workers in the workforce increased from (roughly) 5% to (roughly) 10%.

If this trend continues over the next 4 years the unemployment rate may fall to 5% to 6% but there will probably be 12% to 15% of people who have simply given up on ever finding a job and have left the workforce; this would be a great political win for whoever is in charge but a massive personal loss to tens of millions of American households.


HappySqurriel said:
MDMAlliance said:
HappySqurriel said:
MDMAlliance said:
All these comments about how Obama is the worst president and how people who can defend Obama are blind or whatever, and the comments about "liberals" or "democrats." You guys don't know anything, and you contribute nothing to this thread. You regurgitate what the media of your political party says, or what the people around you say. As for the Romney comments, it somewhat is the same way however it's not nearly as bad as the Obama ones.

It's strange how quick people are to claim that the job unemployment numbers and reports are BS and fixed, yet most of you saying that give no source that really shows you are correct. With all things considered in this situation, if Obama were really as bad of a president you think he is, our numbers would be significantly worse than they were when he got into office. Do you guys remember all the news reports of how high unemployment rates were? Exactly.

The job numbers are heavily manipulated. Over the years the methodology for calculating unemployment has changed and these changes have been to lower the labor force participation rate and therefore reduce unemployment. If we calculated unemployment without these mainpulations we would get the following:

http://www.shadowstats.com/alternate_data/unemployment-charts


As you can see, the traditional methods for calculating unemployment result in both dramatically higher unemployment rates and unemployment that has steadily increased since 2010. The primary reason for this difference is caused because, when the long term unemployed become discouraged and "give up" they are no longer seen as unemployed by the new statistics while they were based on the old methodologies.


In other words, the unemployment rate has fallen below 8% because the job market is so bad that millions of people have given up on ever finding work.

Isn't that chart showing that it's always being "manipulated" then?  There's also not very much to say that the chart is reliable.  Where does this person get his information from?  

All of the data used by the Bureau of Labor Statistics is publicly available, and their methodology is well documented, so he uses the data they collected and calculates the unemployment rate using their old methodology.

Now, through most of the timeframe presented by this graph the unemployment trends have been (basically) the same regardless of the methodology used; with U3 being (roughly) 4% to 5% below U6, and U6 being roughly 4% to 5% below the classical methodology. After 2009 though there is a very drastic difference in the trend being demonstrated by the two methodologies, the official statistics demonstrate a decline in unemployment of (about) 2% while the tradional method demonstrates an increase in unemployment of (about) 2%. What this means is that the number of discouraged workers in the workforce increased from (roughly) 5% to (roughly) 10%.

If this trend continues over the next 4 years the unemployment rate may fall to 5% to 6% but there will probably be 12% to 15% of people who have simply given up on ever finding a job and have left the workforce; this would be a great political win for whoever is in charge but a massive personal loss to tens of millions of American households.


Even if the chart were to be believed and is an accurate representation, my comment was made to those who make rash statements without even knowing anything for themselves.  The chart also shows that in 2008 unemployment rates increased exponentially fast and stopped its rapid growth around 2009.  On all parts it shows a rather steady unemployment rate rather than a rapidly increasing one.  It seems like there's a trend of the rates going up and down quickly, while it does seem to go up a little, doesn't it at least show some improvement over if nothing were done, the rate could have been significantly higher?  

I personally don't know too much about this, but when listening to certain news sources go on about this, I couldn't help but think that there were always people who weren't counted in unemployment.  This wouldn't have been much (if any) different if a Republican (or another candidate) were the President.


MDMAlliance said:


Even if the chart were to be believed and is an accurate representation, my comment was made to those who make rash statements without even knowing anything for themselves.  The chart also shows that in 2008 unemployment rates increased exponentially fast and stopped its rapid growth around 2009.  On all parts it shows a rather steady unemployment rate rather than a rapidly increasing one.  It seems like there's a trend of the rates going up and down quickly, while it does seem to go up a little, doesn't it at least show some improvement over if nothing were done, the rate could have been significantly higher?  

I personally don't know too much about this, but when listening to certain news sources go on about this, I couldn't help but think that there were always people who weren't counted in unemployment.  This wouldn't have been much (if any) different if a Republican (or another candidate) were the President.

Realistically, the unemployment rate couldn't have gone much higher (at least for any significant amount of time) ...

If the banks were allowed to fail the mortgage backed securities that were "worthless" would probably have ended up selling for a tiny fraction of what their book value was. Small(ish) investors would have bought those mortgages, unwound them, resturctured the principle and interest to ensure that the people who held the mortgage could afford them, and sold them at a profit. The average person would have seen their mortgage payment decline significantly, the credit markets would have began to thaw in 2010 or 2011, and we would be seeing significant growth today.

Instead of this we have Zombie banks which can't afford to lend people money because their balance sheet is full of worthless paper, they can't sell this worthless paper because no one wants an asset that is going to decline in value, and they can't even write off their poor investment because doing so would force them into bankruptcy.

The government spent billions of dollars to make a banking system which was less viable in the long run.