


A ranking of the democratic primary contenders
I made three overviews of the field in past months:
That was each time basically a big data dump for the main indicators about how well the campaigns are running. But I feel like this is hard to process. That's why I thought I mix it up a little and rank the contenders into tiers, based on the data. I use the usual A to E ranks and additionally X for extraordinary, so something one or two candidates are far beyond the usual.
I gave a little thought about if I should use relative or absolute criteria for putting the candidates into tiers. Relative means it uses the current race and sets the criteria based on that. Upside would be, that for every category would be candidates in each of the tiers. Absolute criteria are more oriented at how it compares historically to other races. Downside is, that for some categories no candidate at all might reach A-tier. I still decided to go with absolute criteria, because it helps to understand that historically speaking this race is far from over. I make exceptions for some stuff that is hard to compare in absolute terms.
As for categories I used the usual three criteria to gauge a campaign: polls, endorsements and campaign finance. As the DNC has so well defined criteria for qualifying to the debates, debate qualification is the fourth criteria. This is also a category, where I apply relative criteria, as the qualification to debates is incomparable to past nominations. As a fifth criteria I go for media attention, both classical media and social media. And I have a category other for some other stuff that might be interesting but doesn't fit elsewhere.
All data is available in a spreadsheet.
debates
First I go with the debate qualification. This is pretty straightforward. So far candidates could qualify for three debates (actually four, but at the moment there is no difference between qualification for third and fourth debate). So I look at two data points: how many debates the candidate made and how many qualifying criteria he met. As the DNC has two qualifying criteria for each debate (unique donors and polls) a candidate can make at most 6 of these currently.
The tiers are given as follows:
- for debate attendance: 3=A, 2=B, 1=C, 0=E
- for qualifying criterias: 6=A, 5=B, 4/3=C, 2/1=D, 0=E
These are the results:
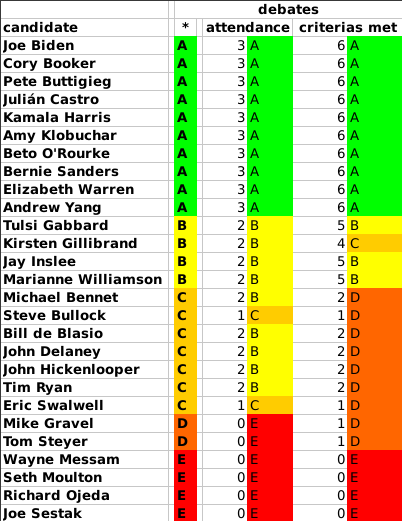
No surprise here, we know that 10 candidates qualified for all three debates, they also have fulfilled all criteria. Therefore they are overall in A-tier. Gabbard, Gillibrand, Inslee and Williamson all fulfilled both criteria for the first two debates, but so far struggle to reach the third debate. They are B-tier. Following are the candidates that made the first two debates only by polling. Gravel and Steyer each haven't made any debate, but have fulfilled the donor-criteria for one. And the rest did never meet one of the qualifying criterias of the DNC.
polling
Polling is interesting. I was thinking for a while how to put the thresholds for the tiers here. There are some points though, that made my decision. If one candidate polls over 50%, that clearly means no other candidate can reach that mark. That must be X-tier then. Another mark is 15%, as this is the hurdle to get delegates. This is a bit complicated though, as this hurdle is both for state and districts, an 538 had an article explaining that. Still 15% is an important milestone, so I put B-tier there and A-tier then at double the amount: 30%. To close it I put C-tier at 5%, D-tier at 1% and E-tier for everyone below 1%.
So for this category I looked at different polling averages. 270 to win and Realclearpolitics both not only have national polling average, but also one for the early voting states (Iowa, New Hampshire, Nevada and South Carolina), so I included that, as these early primary states in the past were important to shape the nomination. I didn't include the polling averages of the Economist and the New York Times in my past overviews, as they put some candidate at '<0%' and this is impossible to graph. But it is fine to put into tiers, so this time they are on board. Also I included this time 10@10 average.
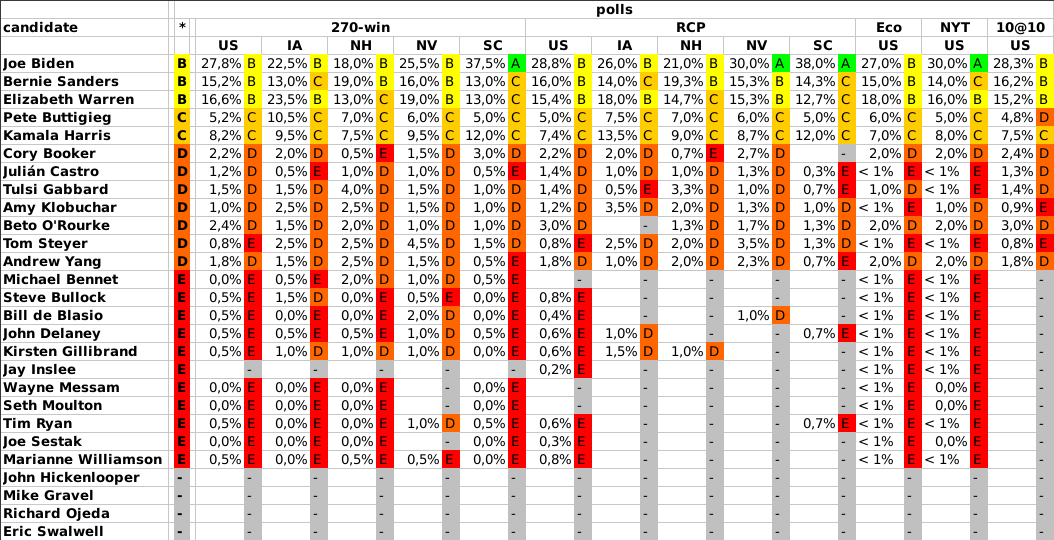
As you can see, none of the candidates made A-tier. This may be because of the crowded field, but the crowded field also means the frontrunner has a harder time to win, so this actually makes sense. Biden is the only one dipping into A-tier in some polls, especially in South Carolina). Sanders and Warren fill up B-tier with solid polls. Buttigieg and Harris make C-tier as the only candidates getting stable over 5%.
endorsements
The next category are endorsements. This is reflecting the theory that the party establishment decides the candidate. Data suggests that endorsement of party officials and party members elected into public office are often a good indicator of the candidate that gets the nomination. But as always: what comes first. Do the endorsements steer the course of the nomination, or are the officials just endorse candidates who look like they would win?
Anyways, so far I am only aware of 538 methodically tracking endorsements. I look both at the point value and the pure number of endorsements. As 538 has a defined pool of possible endorsements, I can make percentages out of these numbers and go with them.
As with polls, if one candidate gathers 50% of the endorsements, no other can (as 538 only count endorsements if they are exclusive). But in difference to polls 15% is not special. Also it is possible to have exactly no endorsement and securing even one endorsement is better in my book. Also endorsements tend to happen in big chunks, so it seems fine to have strong differences between the tiers. So I define the tiers as follows: 50%=X, 20%=A, 5%=B, 1%=C, <1%=D, none=E.
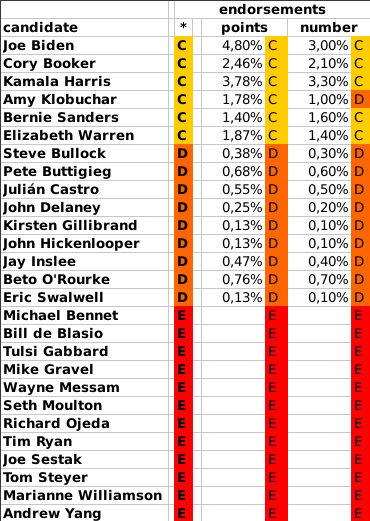
None of the candidates so far comes beyond C-tier. The reason for that is quite simple: the party officials are hesistant this year to support a candidate. That may or may not change as the process continues and more candidates drop out. So far though nothing decisive comes out of the endorsements yet.
It sometimes happened also in the past, that the party officials failed to coalesce around a candidate. Most notably that happened in the 2016 Republican nomination. In the end a candidate the party establishment despised made it: Donald Trump.
campaign finance
I base this data on the official filings at the FEC. So as the last quarterly data filed was up until end of June, the data only reaches that far. Take that into consideration. That means we have no filed data yet from Tom Steyer and Joe Sestak.
I looked at the total funds, as these are used to get the campaign going and at the last quarterly data (Q2), as this is an indication if a campaign gets fired up or slows down. As Wikipedia said in 2016 both Sanders and Clinton got past 200M$ I set X-tier at 250M$. I go down from there with 100M$=A, 50M$=B, 10M$=C, 5M$=D and E-tier for less than that. For quarterly funds I go with 50M$=X, 25M$=A, 10M$=B, 5M$=C and 1M$=D (and E for less).
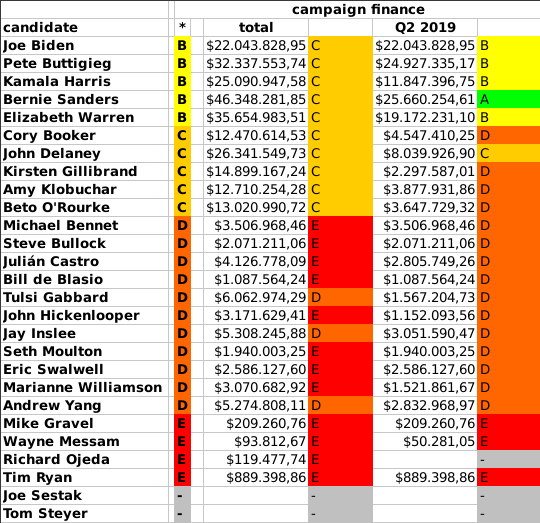
No candidate has so far reached B-tier and above in total finances, as we are still early on. But Sanders and Warren are pretty close and should make it in this quarter. Joe Biden and Buttiegieg can make it there, if Q3 is strong for them.
media attention
For media I looked at a lot of stuff. As before I counted how much major media included the candidate in their lists of major candidates. A-tier is only for making all lists, the other tiers go down from that. Besides that I looked at total cable news mentions in 2019 as counted by the New York Times. I only recalculated it as percentages, to better put them into tiers. Also I included cable news mentions and online stories of the last week, as calculated by 538. For social media attention I counted the number of followers on twitter, facebook and instagram. Again I calculated percentages of the total number for creating tiers.
Here is how it looks:
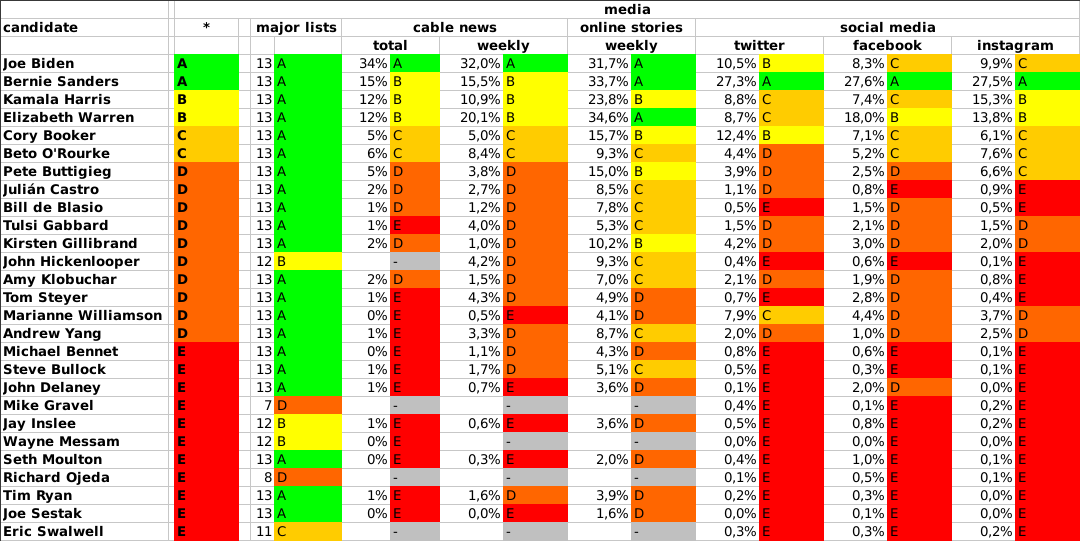
Only Biden and Sanders make A-tier here. But they have different ways to it. Biden gets much attention from classic media, both in cable news and online. Sanders on the other hand is the social media king. Harris and Warren follow on B-tier in the media attention. Booker and O'Rourke make the C-tier. Everyone else is on the lowest two tiers.
other
In this category I collected some interesting critieria not fitting anywhere else. For one I looked into the unique donors each candidate had according to the donor map of the New York Times. This includes data up until end of June. I hope this map gets updated the next quarter, as it is quite interesting. I also look at the number of qualifying polls made for second and third debate. Debate qualification is reached with three (for second) and four (for third) respectively. But the number of qualifying polls each candidate had is also quite telling. And lastly I looked at favorability as asked for by Morning Consult. I substracted unfavorable from favorable for net favorability, and added both for name recognition.
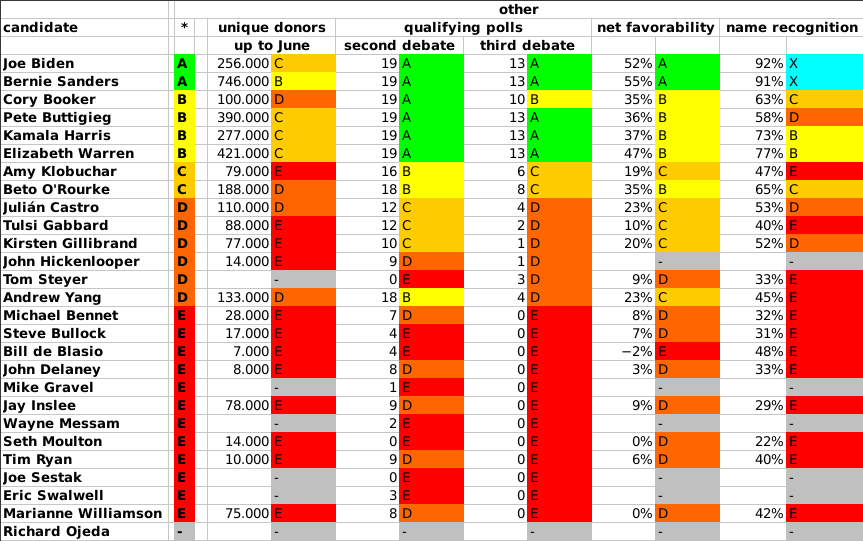
As I expect for candidates vying for the office of president, I assumed they need a high name recognition, so starting with 50% for D-tier and adding 10% for each other tier. Here is really telling, that Biden and Sanders both reached X-tier in name recognition, but everyone else has B-tier max. This means these two are way more well-known than everyone else in the field. They both are also the only ones reaching 50% net favorability, which I set for A-tier.
Sanders is the only one having more than 500 thousand unique donors (at least in June). Elizabeth Warren at least is close here.
result
Well now, if we put all of that together… we get this:
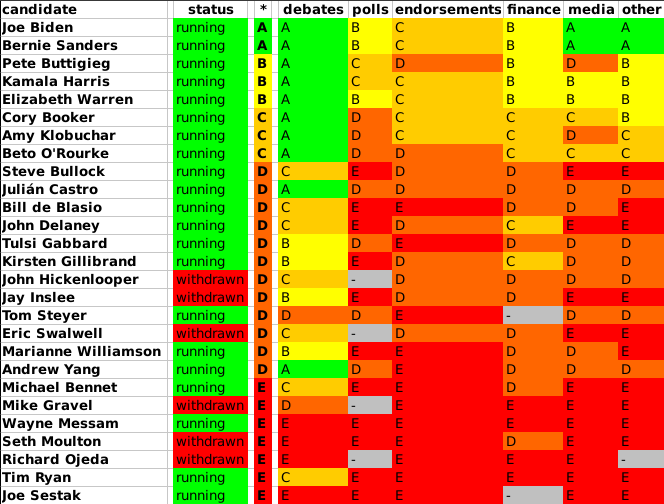
I want to mention that the candidates that have withdrawn so far are among the D- and E-tier. Therefore I expect that Michael Bennet, Wayne Messam, Tim Ryan and Joe Sestak may be the next to drop out.