


A comprehensive overview of the democratic primary contenders
It is about a month since the last overview and a lot happended since then: the first debate influenced the race, Swalwell dropped out, Sestak and Steyer joined the race, the quarterly financial reports were released. And now the second debate will happen soon. So a new overview is in order.
For reference, here the first one from April and the second one from June.
I include my sources as links and also link the download of the gnumeric spreadsheet I used to collect the data.
There are also some other sites recommendable to get a great overview, which you should consider to visit if you want more information:
- The New York Times has a regularly updated site with an overview of polling average (including early state polling), campaign finances and news coverage, which is quite comprehensive.
- Ballotpedia has also an overvieew over the democratic field including campaign finance, debate qualification, endorsements, PredictIt market, congressional voting records with comparisons (for candidates who serve in congress) and poll averages.
As for the impact of the first debate, Fivethirtyeight together with pollster Morning Consult have collected some stats.
field overview
First of an table overview of the field.
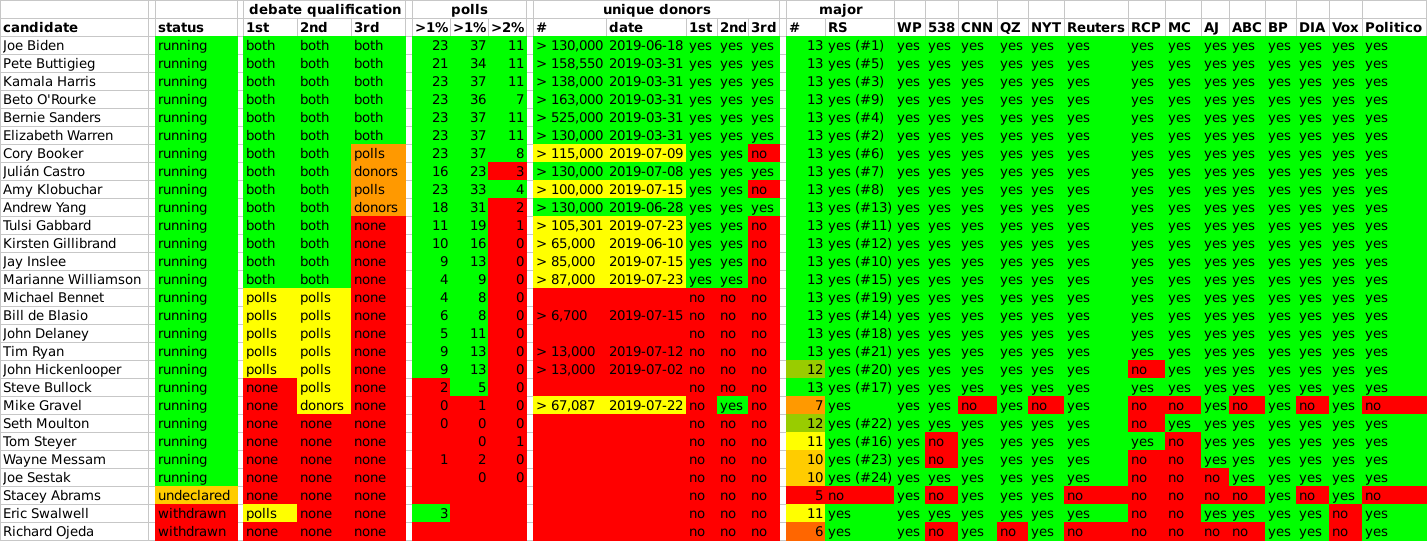
I included everyone who is running and is considered by many media as major, the withdrawn candidacies of candidates who are considered major. I included only one undeclared candidate at this point, this is Stacey Abrams, as she announced a decision (for september) and is also included in some lists.
This list is ordered by the following criteria:
- status of campaign (running, undeclared, withdrawn)
- number of debate participations (max 2 at this point as participants for second debate are already announced; Swalwell and Bullock each only have one participation; Gravel, Moulton, Steyer, Messam, Sestak, Abrams and Ojeda have none)
- The number of fulfilled debate qualification criteria. As so far criteria for three debates are known and each has two criteria (polls and donors) each candidate can reach six at most at this point.
- number of media considering them major (included them in their lists)
- the last name alphabetical (I considered de Blasio as starting with 'd')
To explain the columns: Name and status should be clear. Debate qualification for the three debates include criteria met. This doesn't mean they qualify in the end, for example Gravel met the donor criteria for the second debate but missed out because of the tiebreaker rules. For the third debate I colored the candidates orange that met only one criteria, as for this debate both must be met. The polls columns include the qualifying polls for the three debates, this means also deadlines, starting time (third debate only consider later polls) and value. Unique donors are counted as the current standing, but I included a column to signify for which debates these helped qualifying. And then the media outlets counting the candidates as major (by including them in their lists). The first column here counts the number of inclusions.
Most of the debate qualification data comes from Wikipedia.
The media included is:
- RS = Rolling Stones (has a ranking which I did not consider but mentioned)
- WP = Wikipedia (defines major as candidates who have either held public office, have been included in at least five independent national polls or received substantial media coverage)
- 358 = Fivethirtyeight (defines major as the candidates qualifying for at least one debate or have at least six of ten question answered with yes)
- CNN
- QZ = Quartz
- NYT = New York Times
- Reuters
- RCP = Realclearpolitics (I counted the 20 candidates listed in their average polling as major)
- MC = Morning Consult (which candidates they asked for in their survey)
- AJ = Al Jazeera
- ABC = ABC News
- BP = Ballotpedia
- DIA = Democracy in Action
- Vox
- Politico
polls
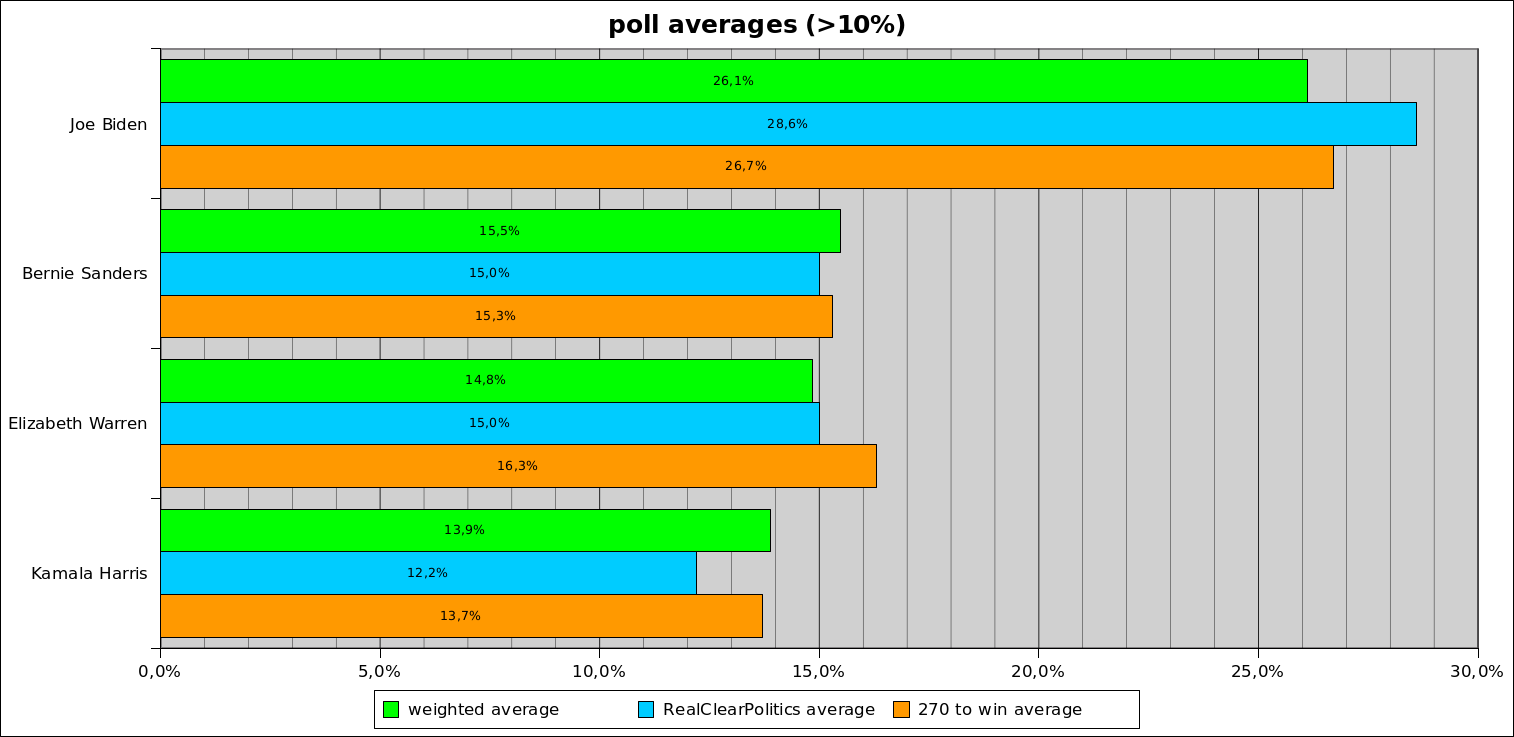
As so much candidates are running and if I included them all in one graph not much was to be seen for the lower polling candidates I decided to split the candidates in three groups for the graph.
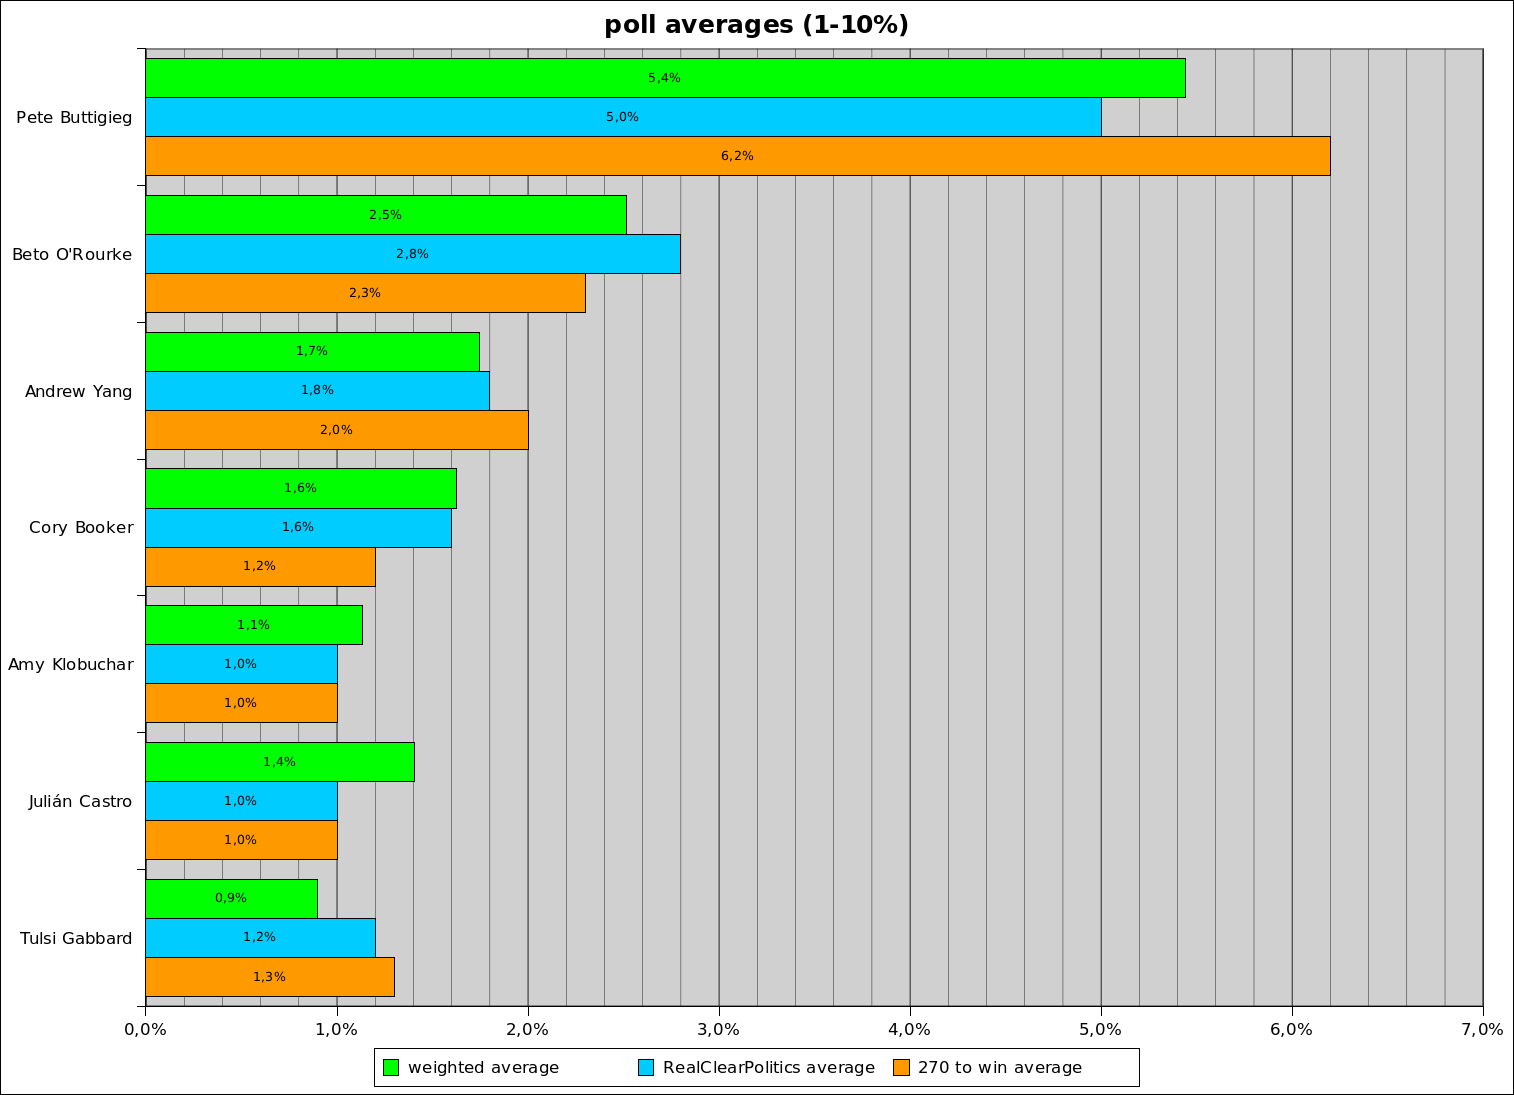
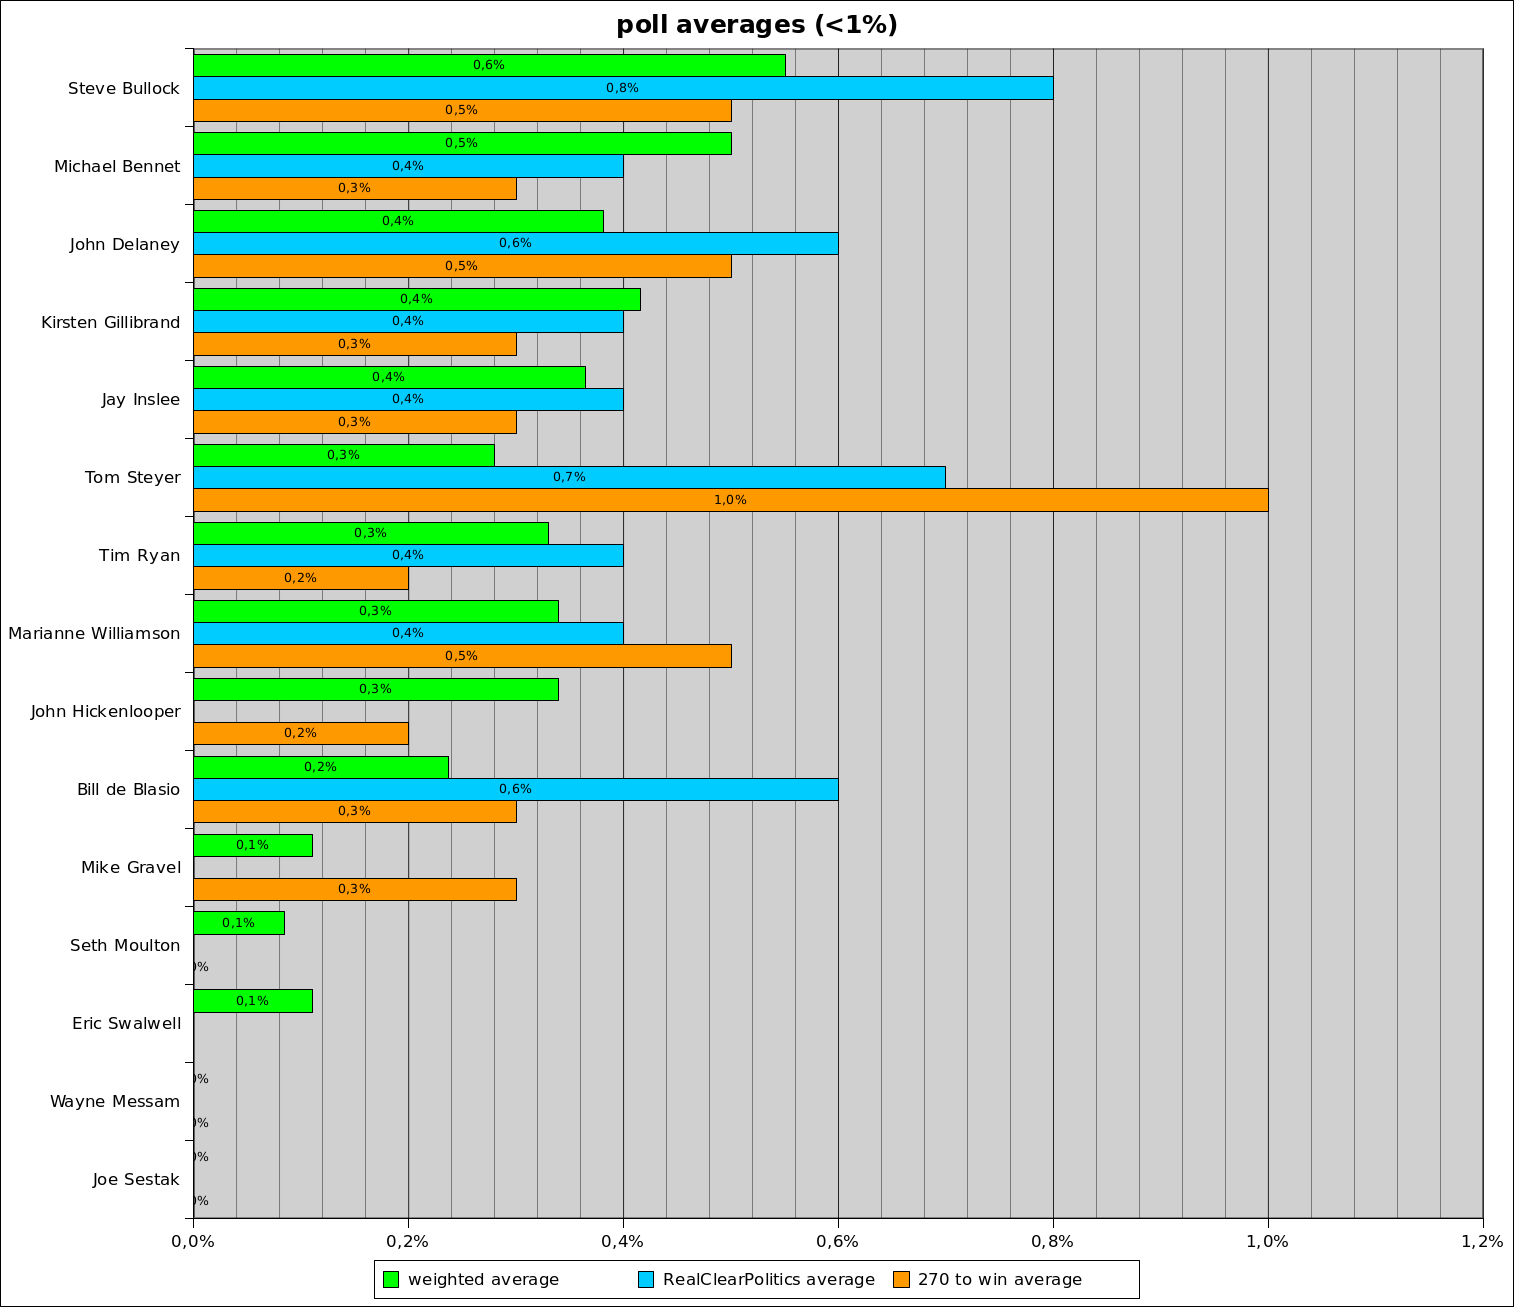
First the frontrunners polling higher than 10%, then the middle field polling between 1% and 10% and at last the bottom of the field polling below 1%.
I included an weighted average I made myself based on the national polls 538 collects including only July-polls, only one poll from each pollster and weighting it based on the rating the pollster has. Also I included the average from Realclearpolitics and from 270 to win.
The frontrunners:
The middle field:
and the bottom of the field:
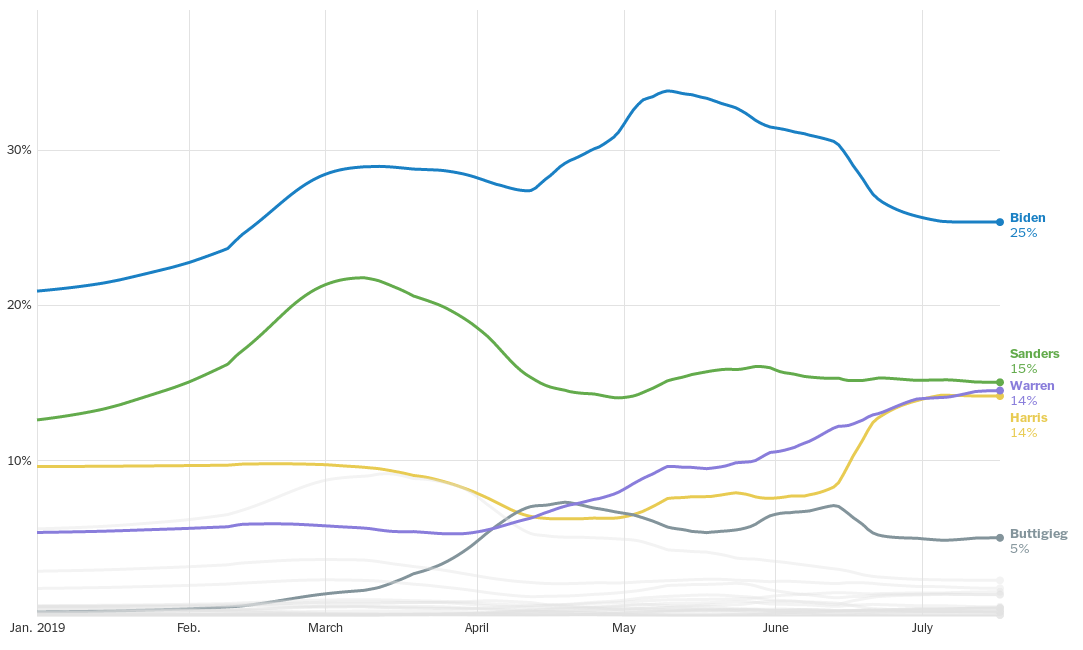
As the above graphs only catch the current standing not the movement over time, I include some more graphs from other sources.
This one is created by Wikipedia:
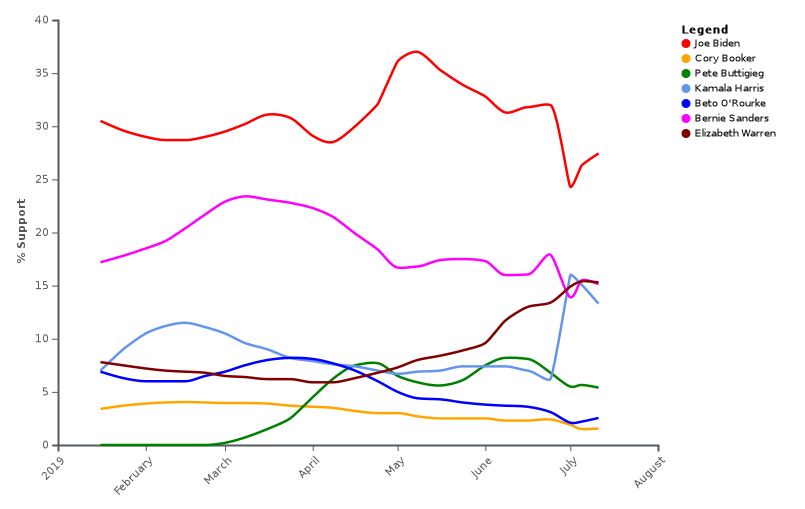
This is the running overview of Realclearpolitics average:

And the average from the New York Times:
endorsements
There is a running theory, that the endorsements (and therefore the will of the party establishment) has a major influence on the eventual candidate. That's why endorsements can be pretty interesting. Sadly so far I only found 538 tracking in a methodic manner the endorsements. Ballotpedia uses 538 tracking in the endorsements they show.
538 tracks endorsements of a pool of state and party officials. They give each one points based on their position, for instance 8 for governeurs and 3 for US house represenatives.
Based on that I made the following graph:

It includes the points 538 counts as well as the basic number of endorsements they track. This can lead to different results. So has Biden more points but fewer persons than Kamala Harris endorsing him. That is because his endorsees include more governors and senators.
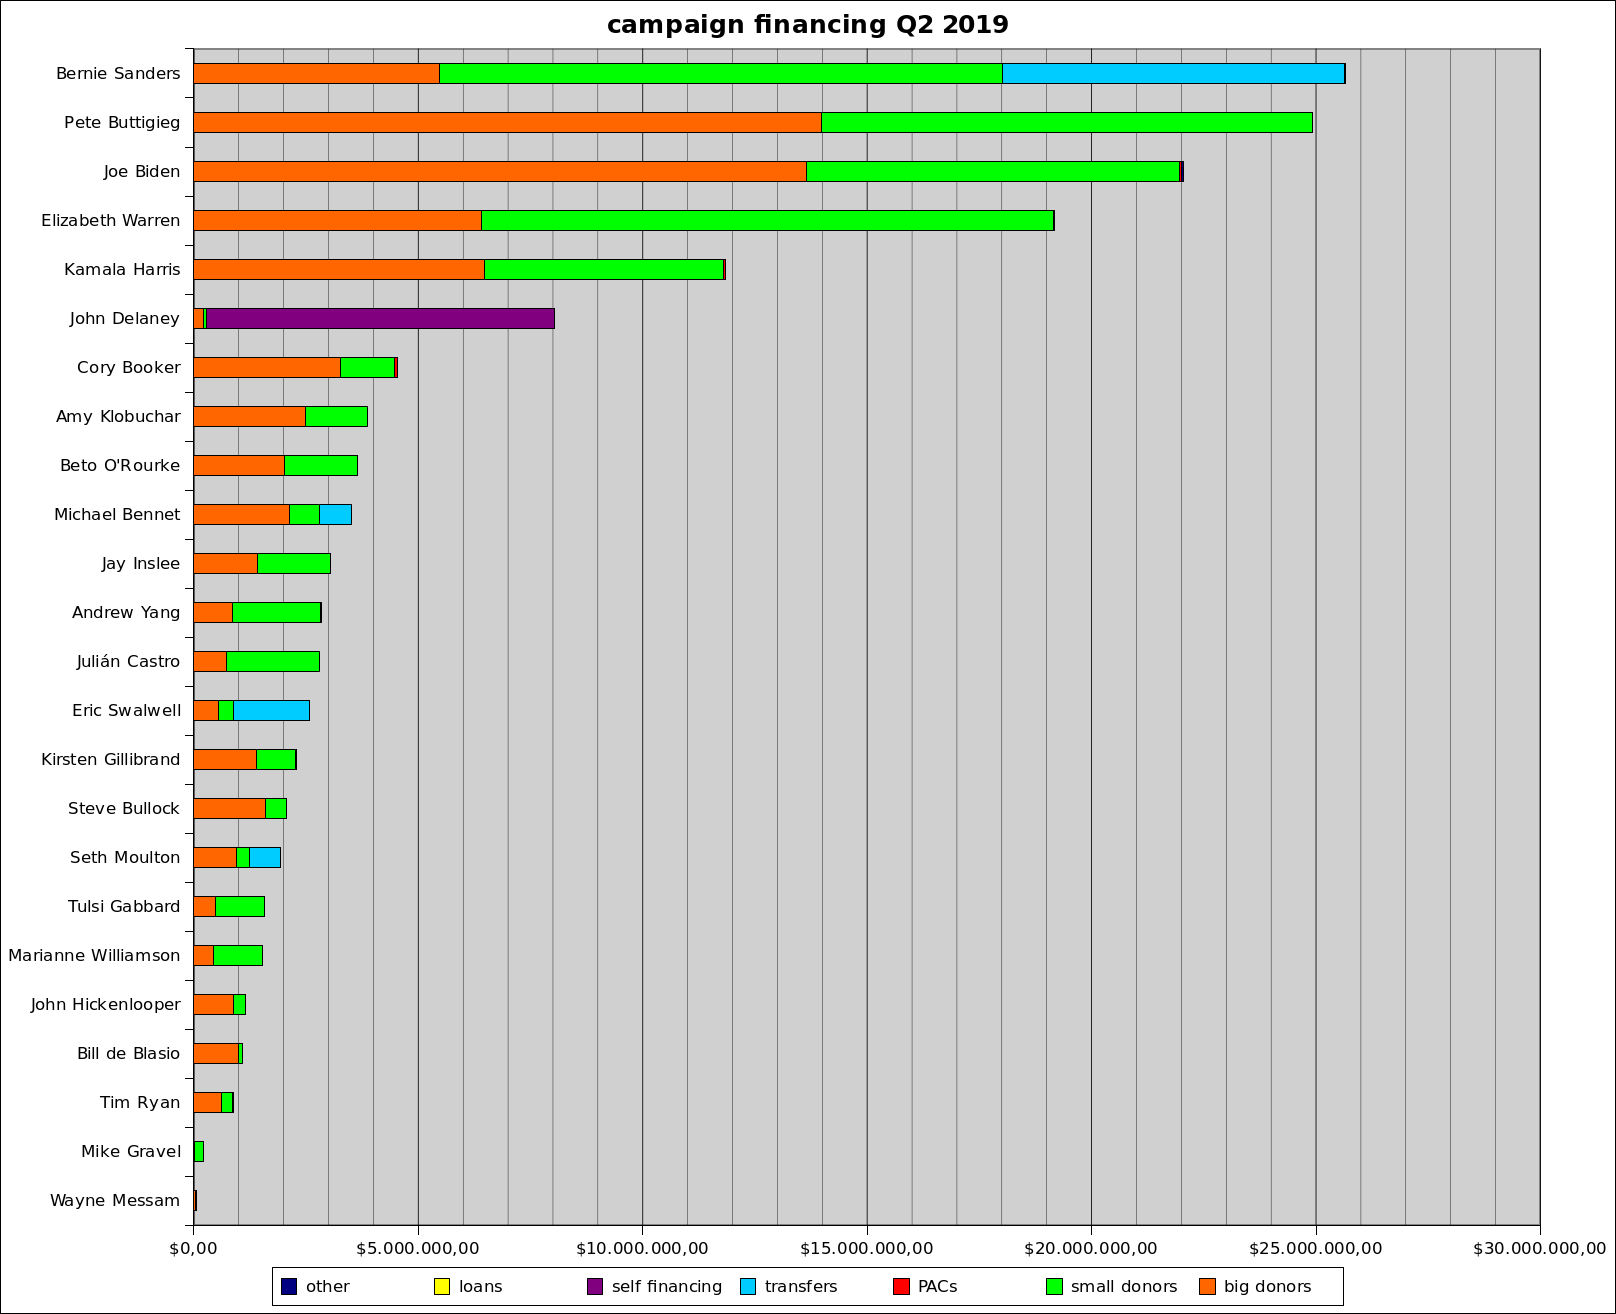
campaign financing
With the new quarterly campaign finance report we have a new look on the money the candidates have got until end of June. based on the FEC-filings I made a breakdown of the sources of money for the last quarter:
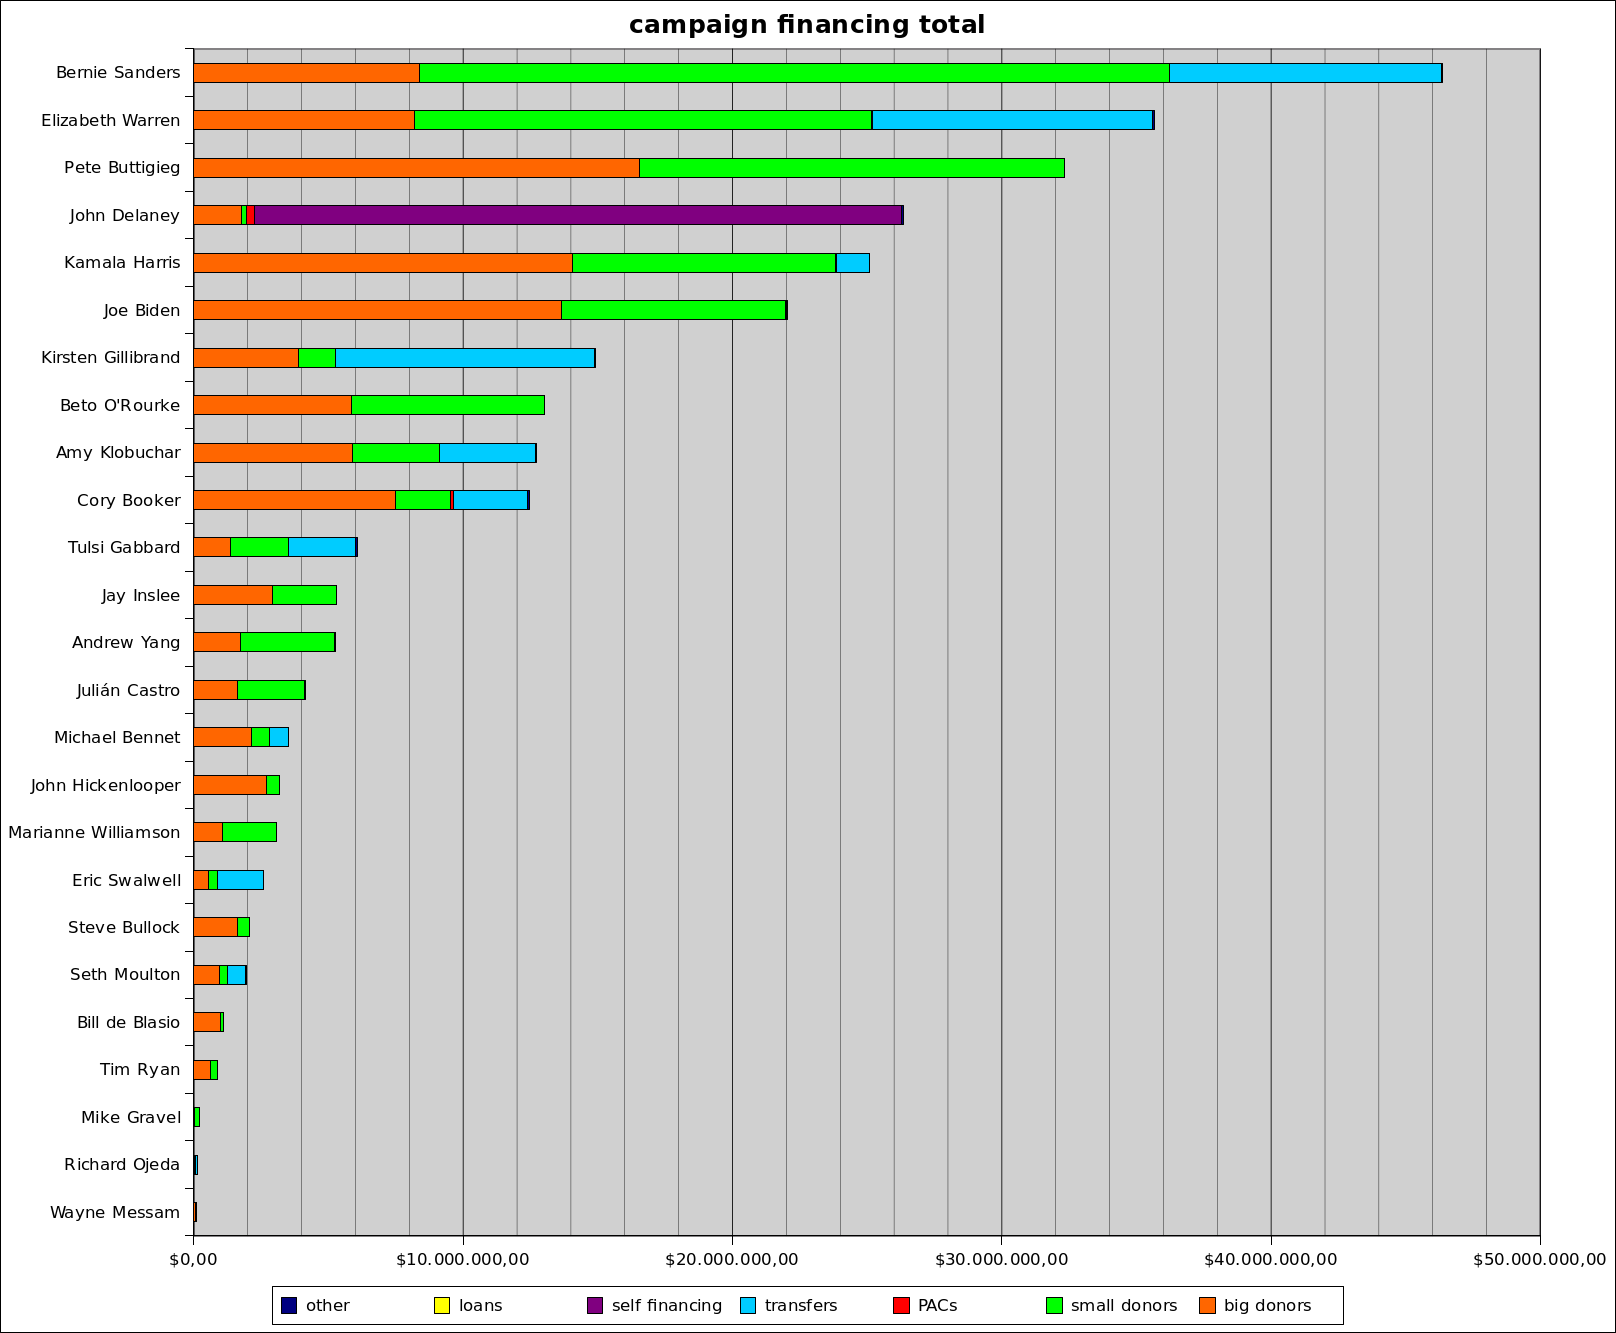
The same can be done for their overall gainings for the whole run of the campaign:
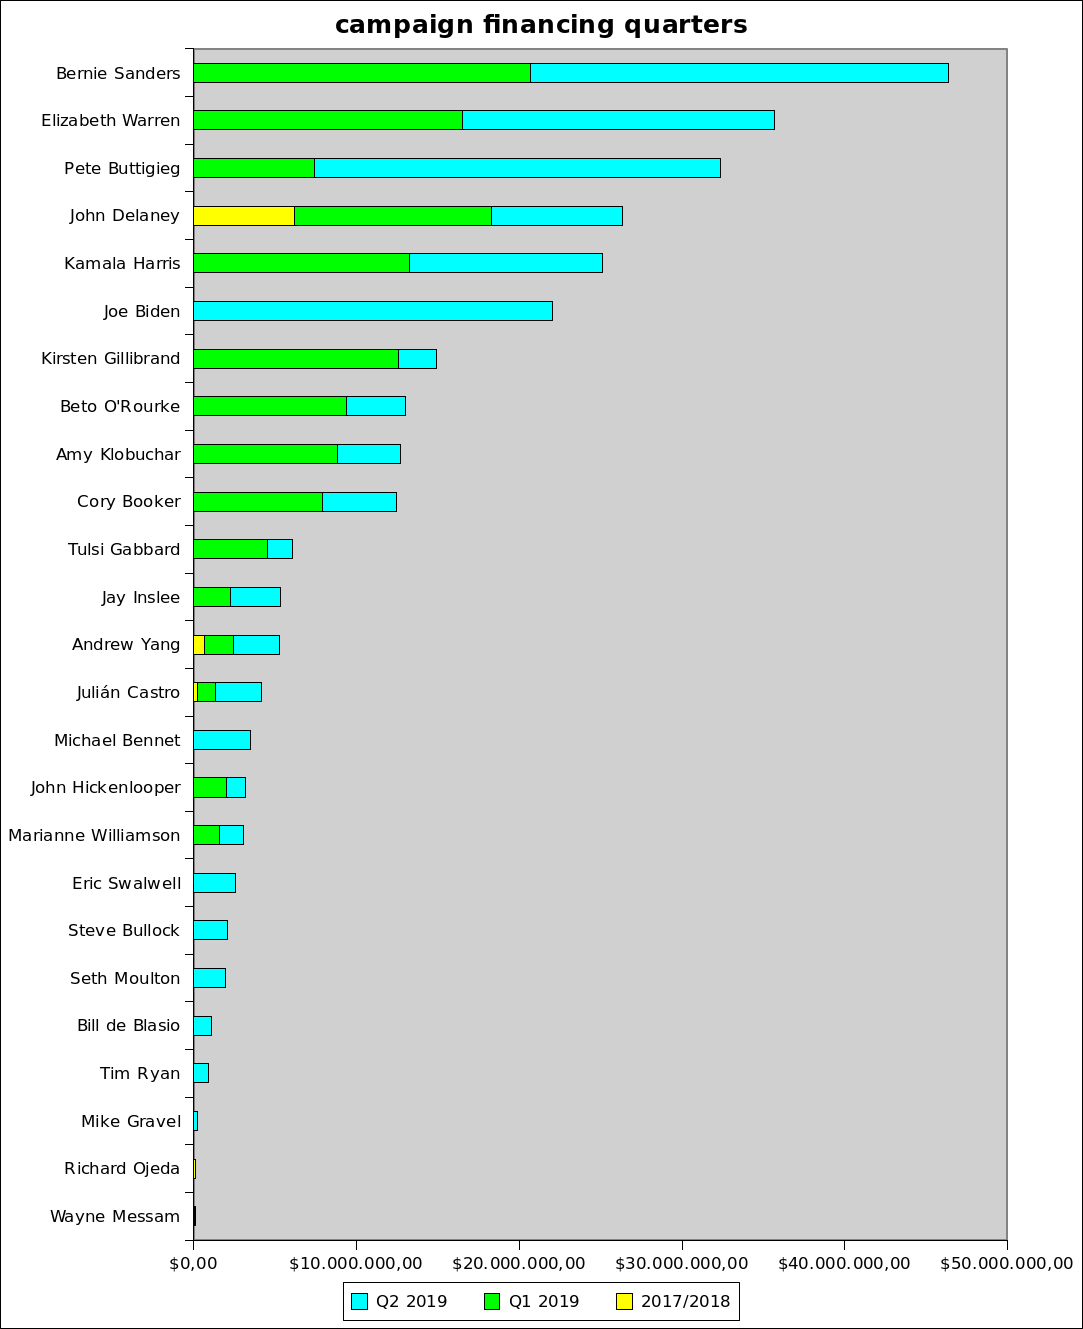
And I also made a graph on how much each candidate made in each quarter to give an impression how it developed over time:
There is an more in-depth analysis about the fundraising in 538.
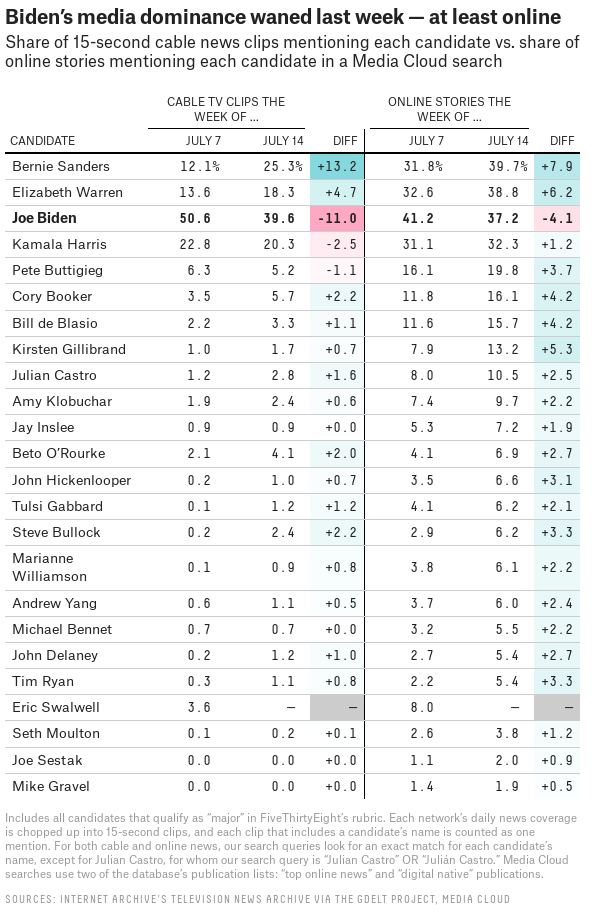
media coverage
538 tracks media coverage of the candidates. This is the table for last week:
The New York Times also tracked media coverage in major cable news, but not weekly but for the full of 2019:

other informations
Democracy in Action has an incomplete overview over the staff the campaigns hired.
Rolling Stones lists the major policy positions of the candidates.