By using this site, you agree to our Privacy Policy and our Terms of Use. Close

Forums - Sales - Reconstructing Gaming History: NYTimes From 6/1/1991 - NES @ 9m in 1989?

This PDF has lots of info, great resource:

http://www.teachme2.co.uk/blog/wp-content/vidgame.pdf

Nintendo Game Boy Worldwide Shipments (Mar 31):

1990: 2.8m
1991: 8.0m
1992: 10.5m
1993: 7.8m
1994: 7.5m
1995: 5.5m
1996: 4.1m
1997: 7.0m
1998: 10.37m
1999: 12.99m
2000: 17.45m
2001: 18.86m
2002: 4.70m
2003: 0.27m

LTD: 118.69m

SOurces:

1990 - 1997

New York Times, December 8, 1997, D4.

1998 - Present:

http://www.nintendo.co.jp/ir/library/historical_data/pdf/consolidated_sales_e0803.pdf


Around the Network

And here is some software data for very old games:


System Title Publisher Units Comment

A2600 Pac-Man Atari 7.000.000 till 01.09.2006
COLV Donkey Kong Nintendo 6.000.000
A2600 Pitfall! Activision 4.000.000
A2600 Missile Command Atari 2.500.000
A2600 Demon Attack Imagic 2.000.000
INT Las V. Pok. & Bl. Jack Mattel 2.000.000 Pack-in
A2600 E.T. the Extra-Trr. Atari 1.500.000
INT MLB Baseball Mattel 1.085.700
A2600 Adventure Atari 1.000.000
A2600 Atlantis Imagic 1.000.000
A2600 Cosmic Ark Imagic 1.000.000
A2600 Kaboom! Activision 1.000.000
A2600 Megamania Activision 1.000.000
A2600 River Raid Activision 1.000.000
A2600 Space Invaders Atari 1.000.000
A2600 Yars' Revenge Atari 1.000.000
INT NFL Football Mattel 1.000.000
INT Astrosmash Mattel 1.000.000 Free bonus
INT Space Armada Mattel 1.000.000
INT Space Battle Mattel 1.000.000
INT Star Strike Mattel 800.000 "nearly"
INT Armor Battle Mattel 700.000
INT Adv. Dungeons & Dr. Mattel 700.000 From the BSRs website
INT Auto Racing Mattel 575.000
INT Night Stalker Mattel 550.000
INT Triple Action Mattel 500.000
INT Sea Battle Mattel 500.000
INT NBA Basketball Mattel 500.000
INT Boxing Mattel 500.000
INT Space Hawk Mattel 500.000
INT US Ski Team Skiing Mattel 450.000
INT SNAFU Mattel 400.000
INT PBA Bowling Mattel 400.000
INT PGA Golf Mattel 375.000
INT Tennis Mattel 350.000
INT Frog Bog Mattel 350.000
INT NHL Hockey Mattel 325.000
INT Bomb Squad Mattel 300.000 Voice game / From the BSRs website
INT Sub Hunt Mattel 300.000
INT NASL Soccer Mattel 300.000
INT B-17 Bomber Mattel 300.000 Voice game
INT Space Spartans Mattel/Sears 300.000 Voice game
INT Utopia Mattel 250.000
INT Horse Racing Mattel 250.000
INT Backgammon Mattel 150.000
INT Checkers Mattel 125.000
INT Shark Shark! Mattel 100.000
INT Reversi Mattel 100.000
INT Las Vegas Roulette Mattel 100.000
INT Vectron Mattel 100.000
INT Sharp Shot Mattel 100.000
INT Tron: Solar Sailer Mattel 90.000 Voice game / From the BSRs website
A2600 Custer's Revenge Mystique 80.000
INT Royal Dealer Mattel 75.000 The lowest sales of any pre-crash release Mattel game


The problem with the "EA Internal" is it contradicts some of my existing data. I assume it's EA's internal estimates.

VIDEO GAME SALES REACH NEW HEIGHTS

Feb 1, 1993 -

UK sales of both Sega and Nintendo video game consoles in 1992 exceeded all expectations. Sales of 16-bit Megadrive from Sega (16 Portland Road, London W11 4LA; +44/71/727-8070) reached 1,005,000 units in 1992, taking UK's installed base to 1.215m units. Coming from behind, the rival Super NES console from Nintendo--only launched mid April 1992--was reckoned to have shipped over 700,000 units during the year, according to its UK distributor Bandai (Unit E1, Fareham Heights, Standard Way, Fareham PO16 8XT, England; +44/329/822565).

Total European Megadrive sales were expected to reach about 2.8m units to give an installed base of over 3.8m. In US, Nintendo's SNES has sold 8m units since launching August 1991. Sega claims that US Megadrive sales will total 4.5m in fiscal year to March 1993 while its new CD-ROM machine--launched November 1992--easily exceeded sales target of 200000 units and expects to have the devices in 1m US homes by end-1993.


Mega Drive is pretty close, but Super Nintendo is way off, maybe Bandai exaggerated '92 shipments, but most accounts have Mega Drive outselling Super Nintendo 2-1 through this period, nearly 4-1 just seems too much.

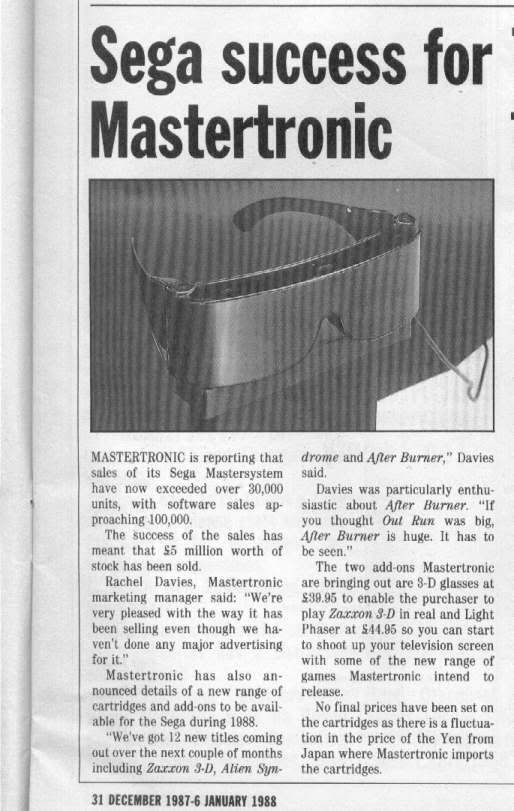
They have Master System at 50k through 1988, but it sold 30k on release at the end of 1987. I would expect 1988 sales to have increased quite a bit over 1987, they certainly shouldn't have dropped. They also have Master System & NES with equal LTD, but I'm pretty sure Master System outsold NES by a significant ammount. Unfortunately accurate data from this era is pretty scant, and this is the most detailed I've seen, but only Mega Drive sales match the data I have (LTD through '91, '92, & '93 all closely match my existing data).

Actually, the 1990 Master System closely matches Sega's figure too (whilst Sega should know Master System sales, I don't trust the figure they give for NES sales).

However 1990 was seen as the turning point. Nintendo found its feet with the leading toy distributor Bandai while both brands promised unfeasibly large advertising spends (which Media Register has since shrunk somewhat).

The first major battle of the brandc occurred among the Santa's grottos where they fought for the Christmas present cash. As so often happens in war both sides claimed victory. Bandai's marketing manager Mike Hayes uses data from the market analysts Lek Track to back up his claims.

"The fact is that Sega has been throwing figures around that are completely false. We've got audited data showing that in December our share was 62% to Sega's 27%."

The figures that so upset Hayes were produced by Virgin Mastertronic and based on its own analysis. International marketing manager Philip Ley maintains that throughout 1990 Sega sold 210,000 machines to Nintendo's 80,000. But why should people believe those in the face of audited data?

"The problem is that Lek Trak only covers high street chains like Dixons," says Ley. "In fact, the driving force of the market is the smaller independent specialists," says Ley. It is in this arena, he says, where Sega has the stranglehold which is not picked up by Lek Trak.


This is one of the most interesting threads I've seen here in a while.

Good stuff.


Leo-j said: If a dvd for a pc game holds what? Crysis at 3000p or something, why in the world cant a blu-ray disc do the same?

ssj12 said: Player specific decoders are nothing more than specialized GPUs. Gran Turismo is the trust driving simulator of them all. 

"Why do they call it the xbox 360? Because when you see it, you'll turn 360 degrees and walk away" 

Hmm I think its about time to show ioi this thread...


People are difficult to govern because they have too much knowledge.

When there are more laws, there are more criminals.

- Lao Tzu

Around the Network

Yeah a lot of good stuff.


 “In the entertainment business, there are only heaven and hell, and nothing in between and as soon as our customers bore of our products, we will crash.”  Hiroshi Yamauchi

TAG:  Like a Yamauchi pimp slap delivered by Il Maelstrom; serving it up with style.

TheSource said:

Also note:

USA Population in 2003 - 291m. PS2 peaked in 2002, so probably ~289m

USA Population in 1990 - 248m. NES peaked in 1989, so probably ~245m

So the USA 2002 Pop= USA 1989 Pop * 1.17

If NES sold ~7.5-8.0m of those shipped units in the USA in 1989, and if I'm remembering correctly, PS2 did 8-9m in the USA in 2002, then PS2 roughly only peaked 17% higher than NES - exactly in line with USA population growth.

Thats all estimation but still fairly stunning if even remotely true.

Thing is though, Nintendo sold so well when they pretty much butchered the competition. Citing the article, they had no less than an 85% Marketshare in '91, and most likely were stronger when they did ship & sell the 8.0m units.

Lets look at it this way:

NES - 8.0m Sold in '89

Competition - Under 1.0m in '89 (11.1% Marketshare)


Playstation 2 - 9.6m Sold in '02 (Source = VGC)

Compeition - 5.8m Sold in '02 (37.6% Marketshare)


So in '89 around 9 million video game consoles sold. In 2002, it was around 15.4m - a 71.1% increase. In 2007, it was 19.625 million consoles. But more importantly: Handhelds sold 15.5m in 2007 versus 8 million in 2002 (and didn't exist in '89)

So we've seen absolutely huge growth (1500% increase) in Handheld sales, and have seen around 117% growth in console sales since 1989...Not too shabby. For comparison, the box office industry has increased 91.8% between 1989 and 2007.


Back from the dead, I'm afraid.

Looking at the old system data, I think the Intellivision hardware number is actually closer to 6M than 3M.

The 3M comes from the pre-crash/Mattel closure sales. It is cited on Wikipedia, coming from a Gamespy description (http://classicgaming.gamespy.com/View.php?view=ConsoleMuseum.Detail&id=17&game=9):

"Despite Mattel's awful marketing, the Intellivision sold over 3 million units. "

This generally refers to what Mattel sold. It is thought that another same amount was sold in the following seven years by INTV Inc. (albeit many as replacement units). I need to find my old Intellivision sales thread (for which much of the software numbers seem to have already appeared here) to check out my sourcing on it.

Mike from Morgantown


I am Mario.


I like to jump around, and would lead a fairly serene and aimless existence if it weren't for my friends always getting into trouble. I love to help out, even when it puts me at risk. I seem to make friends with people who just can't stay out of trouble.

Wii Friend Code: 1624 6601 1126 1492

NNID: Mike_INTV

Here is the link to my old Intellivision sales thread:

http://www.vgchartz.com/forum/thread.php?id=16112

Also, it appears the article from above is the reason for the 6M number:

Despite Mattel's awful marketing, the Intellivision sold over 3 million units. --- Refers to Mattel sales.

In 1991, INTV sold out its stock of Intellivision games and consoles, and the company, along with the Intellivision, faded away. The company went bankrupt later that year, but had managed to sell three million systems during its run—no small accomplishment in the face of Nintendo's market dominance.  -- Refers to INTV Sales.


3M + 3M = 6M


http://classicgaming.gamespy.com/View.php?view=ConsoleMuseum.Detail&id=17&game=9


Mike from Morgantown


I am Mario.


I like to jump around, and would lead a fairly serene and aimless existence if it weren't for my friends always getting into trouble. I love to help out, even when it puts me at risk. I seem to make friends with people who just can't stay out of trouble.

Wii Friend Code: 1624 6601 1126 1492

NNID: Mike_INTV

Right so here are my estimates for NES shipments based on this thread...

FY Ending          Shipped in FY            Total Shipped Worldwide
1983                      650k                                    650k
1984                      1.35m                                   2m
1985                     2.9m                                     4.9m
1986                     5m                                       9.9m
1987                     6.5m                                    16.4m
1988                    8m                                      24.4m
1989                    11m                                    35.4m
1990*                   5m*                                     40.4m 
1991                    8m                                       48.4m
1992                    6.5m                                    54.9m
1993**                  5m                                       59.9m
 
* 7 month fiscal year (vs. 12 month fiscal year for each other FY) ending March 31 1990. Before this point, FY ends 8/31, after this point it ends 3/31.
** VGchartz has data from this point onward.


People are difficult to govern because they have too much knowledge.

When there are more laws, there are more criminals.

- Lao Tzu