By using this site, you agree to our Privacy Policy and our Terms of Use. Close

Forums - Sales Discussion - April 2023 VGChartz Estimates Thread - Worldwide Estimates Out Now

Link to VGChartz article here.

Here we see data representing the sales through to consumers and change in sales performance of the three current platforms (PlayStation 5, Xbox Series X|S, and Nintendo Switch) and two legacy platforms (PlayStation 4 and Xbox One) over comparable periods for 2020, 2021, 2022, and 2023. Also shown is the market share for each of the consoles over the same periods.

Year to Date Sales Comparison (Same Periods Covered)


Market Share (Same Periods Covered)

2020 – (January 2020 to April 2020)

2021 – (January 2021 to April 2021)

2022 – (January 2022 to April 2022)

2023 – (January 2023 to April 2023)

"Year to date" sales for 2020, 2021, 2022, and 2023 sales are shown in series at the top of the table and then just below a comparison of 2023 versus 2022 and 2023 versus 2021 is displayed.  This provides an easy-to-view summary of all the data.

Total Sales and Market Share for Each Year

Microsoft

  • Xbox Series X|S
    • 0.04 million units sold year-to-date
    • Down year-on-year 25,379 units (-39.9%)

Nintendo

  • Nintendo Switch
    • 1.14 million units sold year-to-date
    • Down year-on-year 372,402 units (-24.7%)

Sony

  • PlayStation 5
    • 1.00 million units sold year-to-date
    • Up year-on-year 679,944 units (209.4%)
  • PlayStation 4
    • 0.02 million units sold year-to-date
    • Up year-on-year 23,665 (9,390.9%)


VGChartz Sales Analyst and Writer - William D'Angelo - I stream on Twitch and have my own YouTubeFollow me on Twitter @TrunksWD.

Writer of the Sales Comparison | Weekly Hardware Breakdown Top 10 | Weekly Sales Analysis | Marketshare Features, as well as daily news on the Video Game Industry.

Around the Network

Where can I find this year's with last year's Switch sales comparison table?


Prediction: Nintendo Switch sells 100 million until the end of 2021


JulioMadeira said:

Where can I find this year's with last year's Switch sales comparison table?

https://www.vgchartz.com/tools/hw_yoy.php?reg=Global&start_year=2017&end_year=2023&console=NS

You can use this to see the Switch sales for each month for each year. 


VGChartz Sales Analyst and Writer - William D'Angelo - I stream on Twitch and have my own YouTubeFollow me on Twitter @TrunksWD.

Writer of the Sales Comparison | Weekly Hardware Breakdown Top 10 | Weekly Sales Analysis | Marketshare Features, as well as daily news on the Video Game Industry.

Americas Hardware Estimates for April 2023

Link to VGChartz article here.

Switch Best-Selling Console, PS5 and XS Sales Drop - Americas Hardware Estimates for April 2023

The Nintendo Switch was the best-selling console in the Americas (USA, Canada, & Latin America) with 461,632 units sold for April 2023, according to VGChartz estimates. The Nintendo Switch has now sold an estimated 48.34 million units lifetime in the Americas.

The Nintendo Switch – OLED Model - The Legend of Zelda: Tears of the Kingdom Edition released at the end of April to help boost Switch sales for the month.

The PlayStation 5 sold an estimated 388,966 units to bring its lifetime sales to 16.49 million units. The Xbox Series X|S sold 247,486 units to bring their lifetime sales to 12.71 million units. The PlayStation 4 sold an estimated 2,772 units to bring its lifetime sales to 41.57 million units.

PS5 sales compared to the same month for the PS4 in 2016 are up by nearly 181,000 units, while the Xbox Series X|S compared to the same month for the Xbox One are up by over 61,000 units. PS4 sold 207,994 units for the month of April 2016 and Xbox One sales were at 186,111 units.

PlayStation 5 sales compared to the same month a year ago are up by 110,383 (39.6%). Nintendo Switch sales are up by 55,213 units (13.6%) and Xbox Series X|S sales are down by 82,302 units (-25.0%). The PlayStation 4 is down 13,763 units (-83.2%) year-over-year.

Looking at sales month-on-month, Nintendo Switch sales are up by over 65,000 units, PlayStation 5 sales are down by over 422,000 units, and Xbox Series X|S sales are down by nearly 120,000 units. It should be noted March is a five week month, while April is a four week month.

2023 year-to-date, the PlayStation 5 has sold an estimated 2.37 million units, the Nintendo Switch has sold 1.55 million units, and the Xbox Series X|S has sold 1.22 million units.

Monthly Sales:

Americas hardware estimates for April 2023 (Followed by lifetime sales):

  1. Switch - 461,632 (48,340,781)
  2. PlayStation 5 - 388,966 (16,487,081)
  3. Xbox Series X|S - 247,486 (12,708,510)
  4. PlayStation 4 - 2,772 (41,566,770)

USA hardware estimates for April 2023:

  1. PlayStation 5 - 328,112
  2. Switch - 390,107
  3. Xbox Series X|S - 209,068
  4. PlayStation 4 - 2,370

Weekly Sales:

April 8, 2023 hardware estimates:

Americas:

  1. PlayStation 5 - 97,527
  2. Switch - 82,141
  3. Xbox Series X|S - 59,593
  4. PlayStation 4 - 701

USA:

  1. PlayStation 5 - 82,163
  2. Switch - 69,623
  3. Xbox Series X|S - 50,331
  4. PlayStation 4 - 597

April 15, 2023 hardware estimates:

Americas:

  1. PlayStation 5 - 93,858
  2. Switch - 81,142
  3. Xbox Series X|S - 58,229
  4. PlayStation 4 - 696

USA:

  1. PlayStation 5 - 79,236
  2. Switch - 68,738
  3. Xbox Series X|S - 49,135
  4. PlayStation 4 - 594

April 22, 2023 hardware estimates:

Americas:

  1. PlayStation 5 - 92,565
  2. Switch - 80,188
  3. Xbox Series X|S - 61,415
  4. PlayStation 4 - 683

USA:

  1. PlayStation 5 - 78,127
  2. Switch - 67,987
  3. Xbox Series X|S - 51,868
  4. PlayStation 4 - 587

April 29, 2023 hardware estimates:

Americas:

  1. Switch - 218,161
  2. PlayStation 5 - 105,016
  3. Xbox Series X|S - 68,249
  4. PlayStation 4 - 692

USA:

  1. Switch - 183,759
  2. PlayStation 5 - 88,586
  3. Xbox Series X|S - 57,734
  4. PlayStation 4 - 592


VGChartz Sales Analyst and Writer - William D'Angelo - I stream on Twitch and have my own YouTubeFollow me on Twitter @TrunksWD.

Writer of the Sales Comparison | Weekly Hardware Breakdown Top 10 | Weekly Sales Analysis | Marketshare Features, as well as daily news on the Video Game Industry.

Link to VGChartz article here.

PS5 vs Xbox Series X|S vs Switch 2023 Americas Sales Comparison Charts Through April

Here we see data representing the sales through to consumers and change in sales performance of the three current platforms (PlayStation 5, Xbox Series X|S, and Nintendo Switch) and two legacy platforms (PlayStation 4 and Xbox One) over comparable periods for 2020, 2021, 2022, and 2023. Also shown is the market share for each of the consoles over the same periods.

Year to Date Sales Comparison (Same Periods Covered)

Market Share (Same Periods Covered)

2020 – (January 2020 to April 2020)

2021 – (January 2021 to April 2021)

2022 – (January 2022 to April 2022)

2023 – (January 2023 to April 2023)

"Year to date" sales for 2020, 2021, 2022, and 2023 sales are shown in series at the top of the table and then just below a comparison of 2023 versus 2022 and 2023 versus 2021 is displayed.  This provides an easy-to-view summary of all the data.

Total Sales and Market Share for Each Year

Microsoft

  • Xbox Series X|S
    • 1.22 million units sold year-to-date
    • Down year-on-year 417,530 units (-25.5%)

Nintendo

  • Nintendo Switch
    • 1.55 million units sold year-to-date
    • Down year-on-year 290,894 units (-15.8%)

Sony

  • PlayStation 5
    • 2.37 million units sold year-to-date
    • Up year-on-year 1,183,006 units (99.5%)
  • PlayStation 4
    • 0.01 million units sold year-to-date
    • Down year-on-year 71,992 (-85.0%)


VGChartz Sales Analyst and Writer - William D'Angelo - I stream on Twitch and have my own YouTubeFollow me on Twitter @TrunksWD.

Writer of the Sales Comparison | Weekly Hardware Breakdown Top 10 | Weekly Sales Analysis | Marketshare Features, as well as daily news on the Video Game Industry.

Around the Network

Europe Hardware Estimates for April 2023

Link to VGChartz article here.

PS5 Best-Selling Console as Jump 121% - Europe Hardware Estimates for April 2023

The PlayStation 5 was the best-selling console in Europe with 439,299 units sold for April 2023, according to VGChartz estimates. The PlayStation 5 has now sold an estimated 11.38 million units lifetime in Europe.

The Nintendo Switch sold an estimated 331,947 units to bring its lifetime sales to 31.91 million units. The Xbox Series X|S sold 92,086 units to bring their lifetime sales to 5.83 million units. The PlayStation 4 sold an estimated 3,339 units to bring its lifetime sales to 45.84 million units.

PS5 sales compared to the same month for the PS4 in 2016 are up by nearly 131,000 units, while the Xbox Series X|S compared to the same month for the Xbox One are down by nearly 7,000 units. PS4 sold 308,697 units for the month of April 2016 and Xbox One sales were at 98,957 units.

PlayStation 5 sales compared to the same month a year ago are up by 240,514 (121.0%). Nintendo Switch sales are up by 70,274 units (26.9%) and Xbox Series X|S sales are up by 10,285 units (12.6%). The PlayStation 4 is down 3,427 units (-50.7%) year-over-year.

Looking at sales month-on-month, Nintendo Switch sales are up by over 58,000 units, PlayStation 5 sales are down by over 158,000 units, and Xbox Series X|S sales are down by over 41,000 units. It should be noted March is a five week month, while April is a four week month.

2023 year-to-date, the PlayStation 5 has sold an estimated 1.94 million units, the Nintendo Switch has sold 1.15 million units, and the Xbox Series X|S has sold 0.45 million units.

Monthly Sales:

Europe hardware estimates for April 2023 (Followed by lifetime sales):

  1. PlayStation 5 - 439,299 (11,377,001)
  2. Switch - 331,947 (31,910,049)
  3. Xbox Series X|S - 92,086 (5,831,674)
  4. PlayStation 4 - 3,339 (45,835,239)

Weekly Sales:

Europe April 8, 2023 hardware estimates:

  1. PlayStation 5 - 105,200
  2. Switch - 64,715
  3. Xbox Series X|S - 20,806
  4. PlayStation 4 - 815

Europe April 15, 2023 hardware estimates:

  1. PlayStation 5 - 103,821
  2. Switch - 65,132
  3. Xbox Series X|S - 21,221
  4. PlayStation 4 - 833

Europe April 22, 2023 hardware estimates:

  1. PlayStation 5 - 108,060
  2. Switch - 66,235
  3. Xbox Series X|S - 23,152
  4. PlayStation 4 - 851

Europe April 29, 2023 hardware estimates:

  1. Switch - 135,865
  2. PlayStation 5 - 122,218
  3. Xbox Series X|S - 26,907
  4. PlayStation 4 - 840


VGChartz Sales Analyst and Writer - William D'Angelo - I stream on Twitch and have my own YouTubeFollow me on Twitter @TrunksWD.

Writer of the Sales Comparison | Weekly Hardware Breakdown Top 10 | Weekly Sales Analysis | Marketshare Features, as well as daily news on the Video Game Industry.

Link to VGChartz article here.

PS5 vs Xbox Series X|S vs Switch 2023 Europe Sales Comparison Charts Through April

Here we see data representing the sales through to consumers and change in sales performance of the three current platforms (PlayStation 5, Xbox Series X|S, and Nintendo Switch) and two legacy platforms (PlayStation 4 and Xbox One) over comparable periods for 2020, 2021, 2022, and 2023. Also shown is the market share for each of the consoles over the same periods.

Year to Date Sales Comparison (Same Periods Covered)

Market Share (Same Periods Covered)

2020 – (January 2020 to April 2020)

2021 – (January 2021 to April 2021)

2022 – (January 2022 to April 2022)

2023 – (January 2023 to April 2023)

"Year to date" sales for 2020, 2021, 2022, and 2023 sales are shown in series at the top of the table and then just below a comparison of 2023 versus 2022 and 2023 versus 2021 is displayed.  This provides an easy-to-view summary of all the data.

Total Sales and Market Share for Each Year


Microsoft

  • Xbox Series X|S
    • 0.45 million units sold year-to-date
    • Down year-on-year 54,545 units (-10.9%)

Nintendo

  • Nintendo Switch
    • 1.15 million units sold year-to-date
    • Down year-on-year 91,031 units (-7.3%)

Sony

  • PlayStation 5
    • 1.94 million units sold year-to-date
    • Up year-on-year 1,340,153 units (222.3%)
  • PlayStation 4
    • 0.02 million units sold year-to-date
    • Down year-on-year 15,187 (-45.3%)


VGChartz Sales Analyst and Writer - William D'Angelo - I stream on Twitch and have my own YouTubeFollow me on Twitter @TrunksWD.

Writer of the Sales Comparison | Weekly Hardware Breakdown Top 10 | Weekly Sales Analysis | Marketshare Features, as well as daily news on the Video Game Industry.

Worldwide Hardware Estimates for April 2023

Link to VGChartz article here.

PS5 Best-Selling Console, Zelda OLED Boosts Switch - Worldwide Hardware Estimates for April 2023

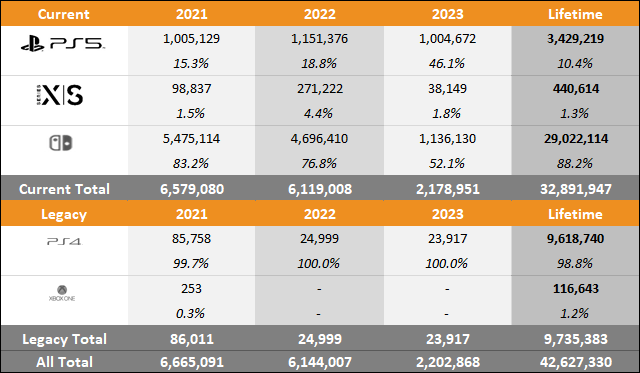
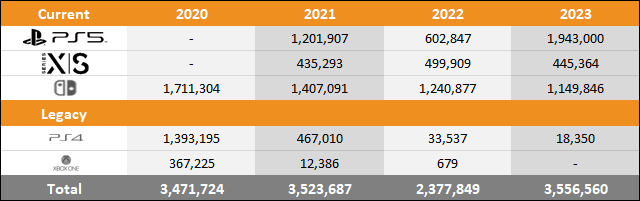
The PlayStation 5 was the best-selling console worldwide with 1,345,894 units sold for April 2023, according to VGChartz estimates. The PlayStation 5 has now sold an estimated 37.44 million units lifetime worldwide.

The Nintendo Switch sold an estimated 1,273,752 units to bring its lifetime sales to 125.06 million units. The Xbox Series X|S sold 372,859 units to bring their lifetime sales to 21.67 million units. The PlayStation 4 sold an estimated 12,972 units to bring its lifetime sales to 117.03 million units.

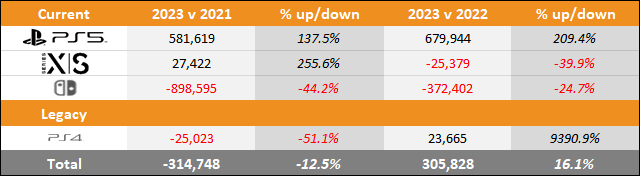
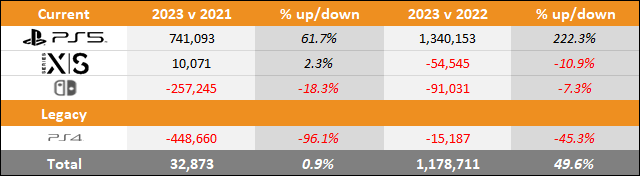
PS5 sales compared to the same month for the PS4 in 2016 are up by over 669,000 units, while the Xbox Series X|S compared to the same month for the Xbox One are up by nearly 60,000 units. PS4 sold 676,414 units for the month of April 2016 and Xbox One sales were at 313,059 units.

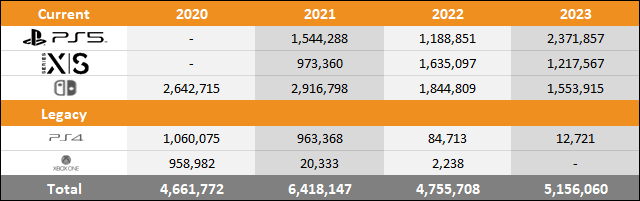
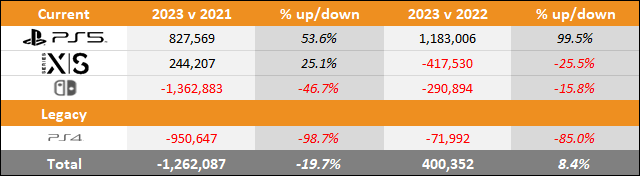
PlayStation 5 sales compared to the same month a year ago are up by 673,730 (100.2%). Nintendo Switch sales are up by 142,499 units (12.6%) and Xbox Series X|S sales are down by 134,647 units (-26.5%). The PlayStation 4 is down 18,065 units (-58.2%) year-over-year.

Looking at sales month-on-month, Nintendo Switch sales are up by nearly 189,000 units, PlayStation 5 sales are down by nearly 755,000 units, and Xbox Series X|S sales are down by over 182,000 units. It should be noted March is a five week month, while April is a four week month.

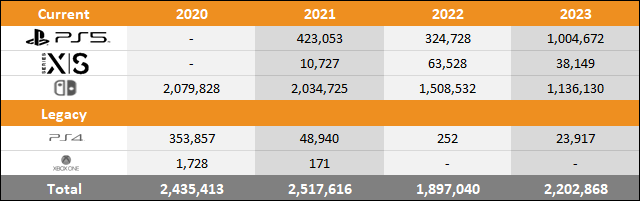
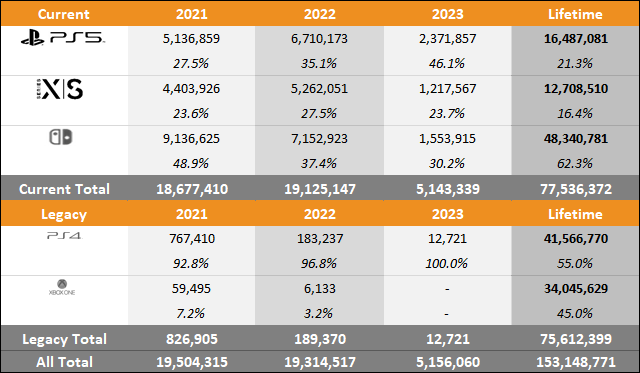
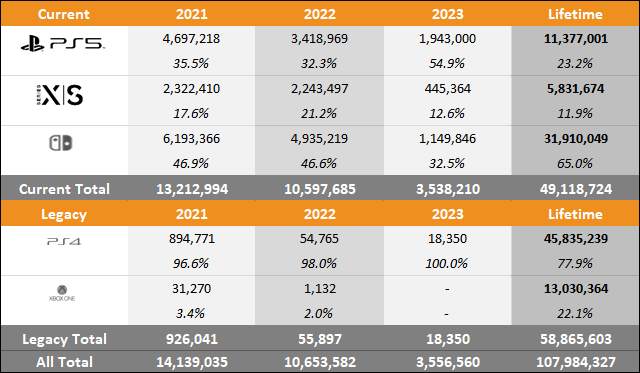
2023 year-to-date, the PlayStation 5 has sold an estimated 6.92 million units, the Nintendo Switch has sold 4.35 million units, and the Xbox Series X|S has sold 1.89 million units.

Check out the breakdown of the Americas sales here, the Europe sales here, and the Japan sales here.

Monthly Sales:

Global hardware estimates for April 2023 (Followed by lifetime sales):

  1. PlayStation 5 - 1,345,894 (37,439,537)
  2. Switch - 1,273,752 (125,055,820)
  3. Xbox Series X|S - 372,859 (21,669,400)
  4. PlayStation 4 - 12,972 (117,033,518)
Americas (US, Canada, Latin America) hardware estimates for April 2023:
  1. Switch - 461,632
  2. PlayStation 5 - 388,966
  3. Xbox Series X|S - 247,486
  4. PlayStation 4 - 2,772
Europe hardware estimates for April 2023:
  1. PlayStation 5 - 439,299
  2. Switch - 331,947
  3. Xbox Series X|S - 92,086
  4. PlayStation 4 - 3,339
Asia (Japan, mainland Asia, Middle East) hardware estimates for April 2023:
  1. PlayStation 5 - 457,544
  2. Switch - 440,216
  3. Xbox Series X|S - 12,496
  4. PlayStation 4 - 6,635
Oceania (Australia and New Zealand) hardware estimates for April 2023:
  1. PlayStation 5 - 60,085
  2. Switch - 39,957
  3. Xbox Series X|S - 20,791
  4. PlayStation 4 - 226

Weekly Sales:

Global April 8, 2023 hardware estimates:

  1. PlayStation 5 - 333,916
  2. Switch - 237,400
  3. Xbox Series X|S - 89,464
  4. PlayStation 4 - 3,360

Global April 15, 2023 hardware estimates:

  1. PlayStation 5 - 331,542
  2. Switch - 230,453
  3. Xbox Series X|S - 86,535
  4. PlayStation 4 - 3,557

Global April 22, 2023 hardware estimates:

  1. PlayStation 5 - 321,685
  2. Switch - 234,660
  3. Xbox Series X|S - 92,585
  4. PlayStation 4 - 2,822

Global April 29, 2023 hardware estimates:

  1. Switch - 571,239
  2. PlayStation 5 - 358,751
  3. Xbox Series X|S - 104,275
  4. PlayStation 4 - 3,233

VGChartz Methodology: Hardware estimates are based on retail sampling and trends in individual countries, which are then extrapolated to represent the wider region. This typically allows us to produce figures that end up being within 10% of the actual totals.

This data is regularly compared against official shipment figures released by the console manufacturers and figures estimated by regional trackers with greater market coverage than ourselves. We then update our own estimates to bring them into line with those figures. This can result in frequent changes often within a short space of time, but we feel it's important to prioritise accuracy over consistency.

Note that our estimates are based on sell-through data (units sold to consumers). In almost all cases the figures released by console manufacturers are based on shipment data (sell-in), where as soon as a device has left the factory and entered the supply chain for delivery it is considered a sale. This is why there is always a difference between the companies’ figures (sell-in) and VGChartz estimates (sell-through), even after we’ve made adjustments. The one exception to that is when a console has been discontinued and the remaining stock has finally sold out – at that point the figures will match.

Last edited by trunkswd - on 22 May 2023

VGChartz Sales Analyst and Writer - William D'Angelo - I stream on Twitch and have my own YouTubeFollow me on Twitter @TrunksWD.

Writer of the Sales Comparison | Weekly Hardware Breakdown Top 10 | Weekly Sales Analysis | Marketshare Features, as well as daily news on the Video Game Industry.

Switch did very well and May should be the same story, June onwards will be a return to the decline though. After a couple insane months the PS5 is returning to earth though it's still doing way, way better than the PS4 did at this point and somewhat over a million could be the norm for it the next few months which will make it easily surpass 20m this year. And Xbox Series is still doing somewhat better than the Xbox One did but with how the other two are doing it's doing just ok right now. The next Xbox showcase is soon though so maybe that'll help some.


Norion said:

Switch did very well and May should be the same story, June onwards will be a return to the decline though. After a couple insane months the PS5 is returning to earth though it's still doing way, way better than the PS4 did at this point and somewhat over a million could be the norm for it the next few months which will make it easily surpass 20m this year. And Xbox Series is still doing somewhat better than the Xbox One did but with how the other two are doing it's just doing ok right now. The next Xbox showcase is soon though so maybe that'll help some.

Some of that pent up PS5 demand is starting to be met. PS5 sales will remain high going forward, especially with Sony forecasting 25M PS5s for the current fiscal year.

I agree that Switch sales should remain really strong in May, but afterwards will go back to being down year-on-year. You never know with holidays with deals, but May is likely the last month the Switch has a chance to be the best-selling console in a given month.

Xbox Series X|S sales in May are looking to be better than in April (with the limited data we have so far) with a chance to be up year-on-year as sales last May were 466K, or at least down year-on-year by far less percent wise than we've seen so far this year. And yeah, it is doing better than the Xbox One, it just looks worse than it is with how high PS5 and Switch sales are right now. I still see Xbox Series X|S selling 60m-70m lifetime due to the stronger first-party lineup of games.

It should be noted April had 4 weeks compared to 5 weeks for March. Here are the average weekly sales for March and April.

March:

  • PS5: 420,157/wk
  • NS: 216,981/wk
  • XS: 111,062/wk

April:

  • PS5: 336,473/wk
  • NS: 318,438/wk
  • XS: 93,214/wk


VGChartz Sales Analyst and Writer - William D'Angelo - I stream on Twitch and have my own YouTubeFollow me on Twitter @TrunksWD.

Writer of the Sales Comparison | Weekly Hardware Breakdown Top 10 | Weekly Sales Analysis | Marketshare Features, as well as daily news on the Video Game Industry.