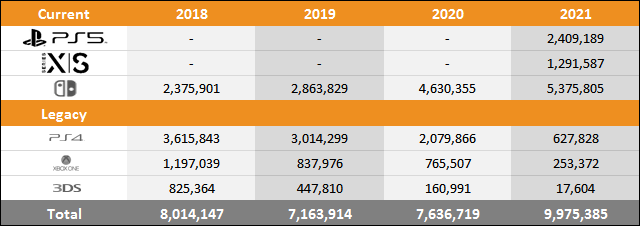
| trunkswd said: Share the article here. PS5 vs Xbox Series X|S vs Switch Sales Comparison Charts Through March 27Here we see data representing the global sales through to consumers and change in sales performance of the three current platforms (PlayStation 5, Xbox Series X|S, and Nintendo Switch) and three legacy platforms (PlayStation 4, Xbox One, and Nintendo 3DS) over comparable periods for 2018, 2019, 2020, and 2021. Also shown is the market share for each of the consoles over the same periods. Year to Date Sales Comparison (Same Periods Covered)
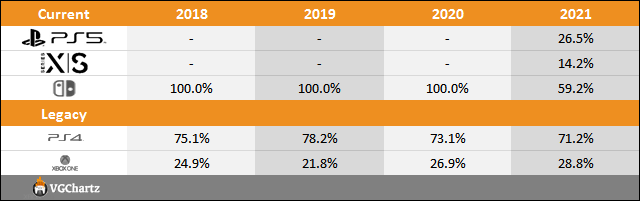
Market Share (Same Periods Covered)
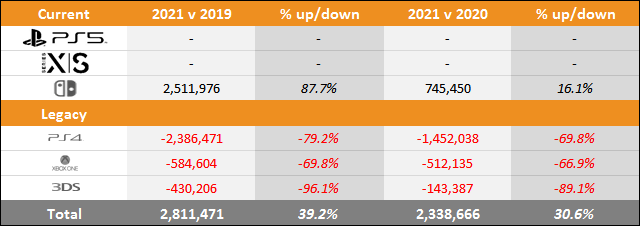
2018 – (Week ending January 13 to March 31) 2019 – (Week ending January 12 to March 30) 2020 – (Week ending January 11 to March 28) 2021 – (Week ending January 9 to March 27) "Year to date" sales for 2018, 2019, 2020, and 2021 sales are shown in series at the top of the table and then just below a comparison of 2021 versus 2020 and 2021 versus 2019 is displayed. This provides an easy-to-view summary of all the data. Total Sales and Market Share for Each Year
Microsoft
Nintendo
Sony
|
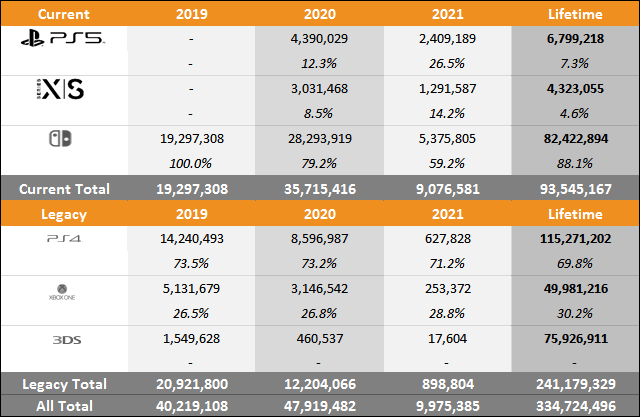
Reviewing the charts now, for NSW 2020 I get 4,296,041 through 12 weeks and 5,089,385 for 13 weeks. It seems like there's an extra 334K in your number.