By using this site, you agree to our Privacy Policy and our Terms of Use. Close

Forums - Sales Discussion - Q3 2013 Hardware Analysis (VGC Exclusive)

Quater 4 Analysis


By: Michael-5

Hey guys, thanks for reading my Quarterly analysis. For those unfamiliar with my quarterly analysis's here are link to my older analysis's. Q3 and Prior I merged hardware and software, but I found that to be info overload, so I separated Hardware/Software.

Quarter 4 2012

Quarter 3 2012
Quarter 2 2012
Quarter 3 2010
GameTrailers Archive

I used to make these on GameTrailers before and when I first joined VGC, but now I have kind of migrated here. There is a gap between 2010 and 2012, but it's only because I would write these articles up, but never publish them.

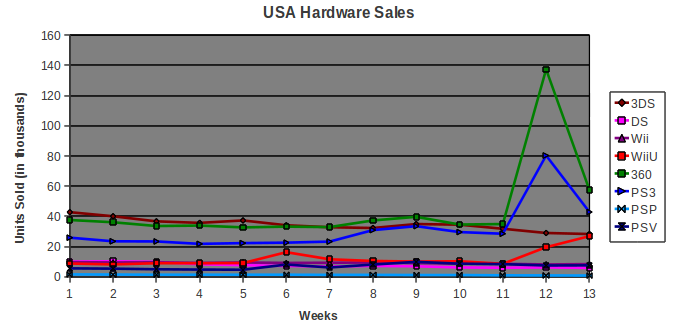
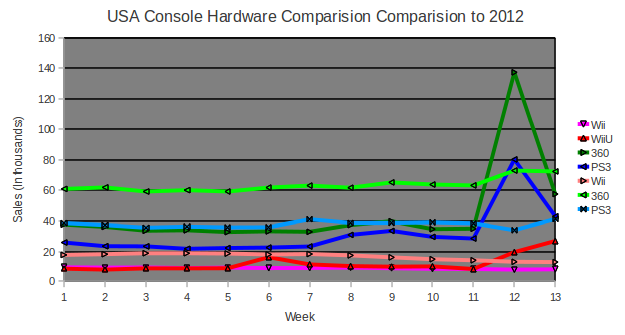
To save me time, I numbered the 13 weeks 1-13 on the charts, and they correspond to the first week of July up the the last week of September for the respective year. Also note that the top lines for consoles represent current quarter sales, and the bottom lines represent past sales (i.e. 3DS is bright red for 2013, dark red for 2012. PS3 is Dark Blue in 2013, and Cyan in 2012, etc).

I also asked TrunkSwd if I could write these as articles on VGC, but haven't received an answer yet. So, if you like this, and think it's as good or better then VGC's own articles, go spam message him or other Administrators.

Anyway, lets begin with graphs showing hardware sales for all platforms in all regions, the graphs should be self explanitory
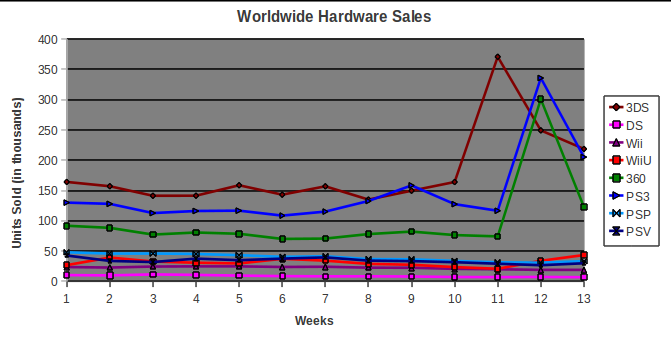
Platform Q3 Sales
3DS 2.35 million
PS3 1.90 million
360 1.30 million
PSP 0.51 million
PSV 0.44 million
WiiU 0.41 million
Wii 0.29 million
DS 0.11 million

3DS was the best selling system WW for Q3 2013, followed by PS3, and then 360. Since the One reveal, 360 sales have struggled to keep up with PS3 sales, to the point where a new Slim model didn't even boost sales (note a marginal boost for PS3 in early September). WiiU and PSV have been struggling, but with the price cut and Wind Waker bundle launched in October, sales for Q4 look hopeful for WiiU. PSV still has a hard battle, but anything can happen Q4.
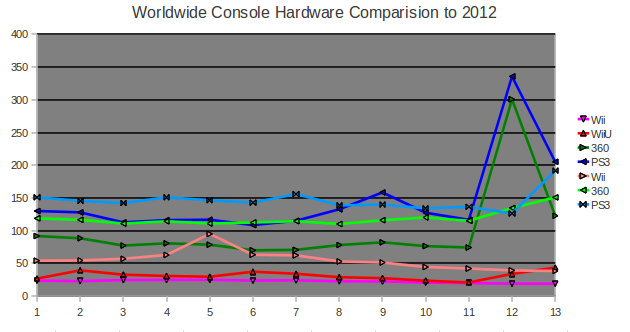
 

The first console labeled in the legend represents 2013 sales, the second represents 2012 sales. E.g. PS3 is Dark Blue in 2013, and Cyan in 2012.


Platform Q3 2012 Sales Q3 2013 Sales % Difference Market Share
PS3 1.90 million 1.90 million -0.1% 54.6%
360 1.54 million 1.29 million -16.4% 37%
WiiU N/A 0.41 million N/A 100% -8th Gen
Wii 0.72 million 0.29 million -59.3% 8.4%

Due to Grand Theft Auto, 360 sales aren't down too much this quarter, and PS3 has kept even. Wii sales have crashed though, which is expected since the last 1st party game released over a year ago.
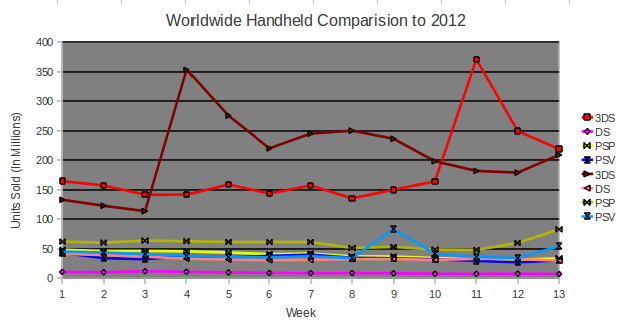
 

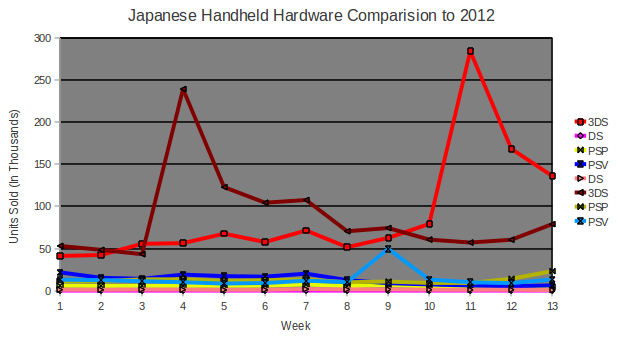
The first console labeled in the legend represents 2013 sales, the second represents 2012 sales. E.g. 3DS is Dark Red in 2012 and Bright Red in 2013.


Platform Q3 2012 Sales Q3 2013 Sales % Difference Market Share
3DS 2.72 million 2.35 million -13.4% 86.6% - 8th Gen
PSP 0.77 million 0.51 million -33.6% 66.4%
PSV 0.56 million 0.44 million -20.2% 13.4% - 8th Gen
DS 0.43 million 0.11 million -73.5% 33.6%

3DS sales are interesting to track because despite being down 13.4% this quarter, this doesn't imply that 3DS won't be up YoY. 3DS had a hard battle since Q1&2 sales of 2012 were high due to the $80 price cut in 2011, and Q3 sales are down because of the release of the 3DS XL in 2012. However with the release of Monster Hunter 4 in Japan and Pokemon worldwide, there is a good chance 3DS can make up the small 13% gap (for the entire year). PSV numbers however are less hopeful, not only is it down 20% from last year (likely because Persona pushed sales in 2012), they are still below PSP numbers a year and a half after release. Q4 will be interesting as they will see if how well 3DS will do, if Vita has hope, and where DS will peak at.


What is with all the hate? Don't read GamrReview Articles. Contact me to ADD games to the Database
Vote for the March Most Wanted / February Results

Around the Network


Platform Q4 2012 Sales
360 0.58 million
3DS 0.45 million
PS3 0.41 million
WiiU 0.16 million
Wii 1.12 million
DS 0.098 million
PSV 0.090 million
PSP 0.016 million

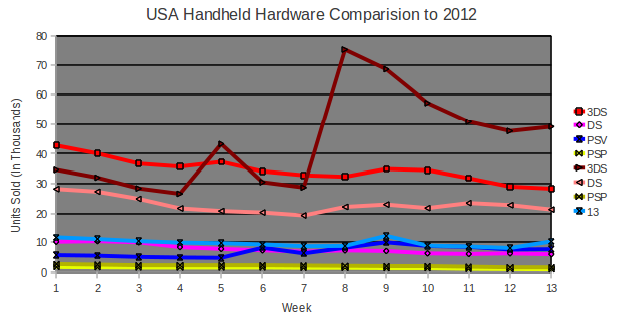
PSP is dead in USA, and Vita is not doing much better being behind the DS. Microsoft continues to dominate in USA with it's domestic product, but PS3 and 3DS have strong numbers despite being foreign. WiiU didn't do too horrid either, outselling the Wii by 33%.

Platform Q3 2012 Sales Q3 2013 Sales % Difference Market Share
360 0.83 million 0.58 million -29.6% 52.5%
PS3 0.49 million 0.41 million -16.5% 36.9%
WiiU N/A 0.16 million N/A 100% - 8th Gen
Wii 0.22 million 0.12 million -45.8% 10.6%

Despite 360 being dominate in USA, PS3 isn't falling as hard with the end of the 7th generation. I personally noticed that after E3 2013, 360 sales dropped significantly and haven't been able to revive, where PS3 has remained steady. The poor XB One reveal likely hurt the brand, but we will see if this matters come Q4. I should mention that PS3/360 were down about 25-40% prior to GTAV's release, this one game really gave the system some life support.

Platform Q3 2012 Sales Q3 2013 Sales % Difference Market Share
3DS 0.57 million 0.45 million -21.4% 83.3% - 8th Gen
DS 0.30 million 0.098 million -66.7% 85.7%
PSV 0.13 million 0.090 million -28.9% 16.7% - 8th Gen
PSP 0.026 million 0.016 million -37.7% 14.3%

All platforms are down significantly. DS is on the verge of being discontinued, PSP is on life support, and 3DS/Vita sales are hurt. 3DS is hurt primarily because of the 3DS XL launch early in the quarter, and Vita is just struggling.

P.S. 13 is Vita sales from Q3 2012, my mistake.


P.S. sorry for the incorrect title for Americas in the first graph, I would edit this if I were a writer on VGC, but this is just a forum post. I edit these graphs on a different computer and am too lazy to edit them and re-upload them


What is with all the hate? Don't read GamrReview Articles. Contact me to ADD games to the Database
Vote for the March Most Wanted / February Results


Platform Q4 2012 Sales
PS3 0.84 million
3DS 0.52 million
360 0.44 million
PSP 0.21 million
WiiU 0.121 million
PSV 0.119 million
DS 0.009 million

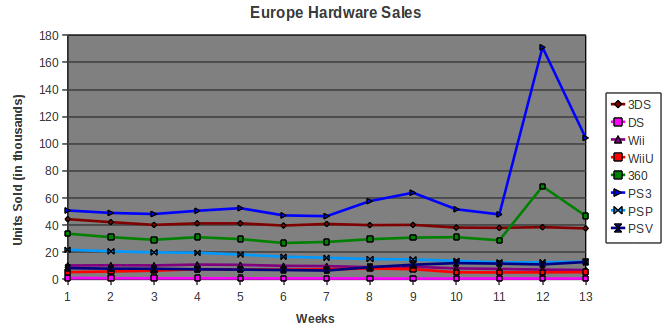
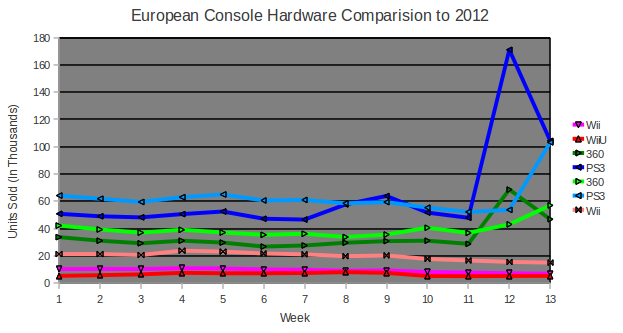
The top 3 systems are a reciprocal of USA's, with PS3 in first and 360 in 3rd. PS3 and 360 saw strong sales in Europe large due to the release of GTAV. In fact GTAV and FIFA 14's release weeks are the only 2 weeks 360 managed to top the 3DS. This game pushed so many consoles, it almost makes the rest of the graph look irrelevant. PSP is doing okay, likely due to sales in other regions outside of Europe (because VGC thinks Europe is the whole world outside North America and Japan)


Platform Q3 2012 Sales Q3 2013 Sales % Difference Market Share
PS3 0.82 million 0.84 million +2.9% 59.8%
360 0.51 million 0.44 million -13.3% 31.6%
Wii 0.26 million 0.12 million -53.2% 8.6%
WiiU N/A 0.08 million N/A 100% - 8th Gen

GTAV was big, that's the jist of the last quarter. If it weren't for GTAV, PS3 would be down YoY and the drop for PS3/360 would be large. You can see that on average PS3/360 were doing about 80% as well as they did in 2012, with PS3 matching itself on the last week of the quarter (The FIFA week). Had there been no GTAV, PS3 probably wouldn't have matched itself on that last week. Not much else to say, prior to the WiiU price cut and Wind Waker bundle WiiU was doing pretty badly, but Q4 has hope. Wii is crashing.

Platform Q3 2012 Sales Q3 2013 Sales % Difference Market Share
3DS 0.81 million 0.52 million -35.7% 81.4% - 8th Gen
PSP 0.30 million 0.21 million -29.1% 95.8%
PSV 0.19 million 0.12 million -36.2% 18.6% - 8th Gen
DS 0.07 million 0.014 million -85.9% 4.2%

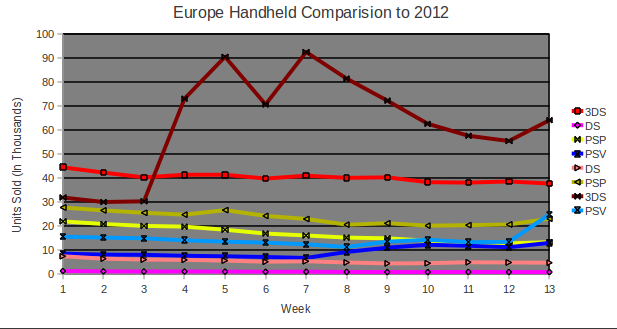
Hand helds show much the same drop, DS is phasing out, PSP is slowly declining due to being phased out in Europe, but remaining relavent in Latin America. 3DS can't keep up with itself because of the 3DS XL model release in 2012, and PSV is just struggling. Q4 will be interesting with Pokemon, and the 2DS pushing 3DS system sales. I'm not sure what will happen to Vita


What is with all the hate? Don't read GamrReview Articles. Contact me to ADD games to the Database
Vote for the March Most Wanted / February Results


Platform Q4 2012 Sales
3DS 1.17 million
PSV 0.170 million
PS3 0.160 million
WiiU 0.120 million
PSP 0.073 million
Wii 0.016 million
360 0.0038 million
DS 0.0004 million

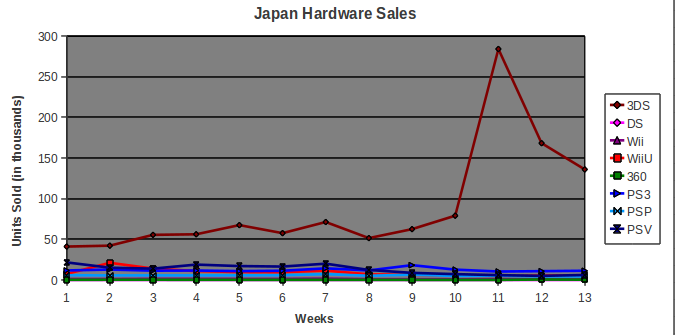
Now if you thought GTAV made the above graphs look useless, lets look at Monster Hunter 4's effects in Japan, and the 3DS's overall dominacne of the market......3DS is killing it in Japan, it's the only region where 3DS is up YoY, and from what I've seen from Pokemon Numbers, 3DS will continue to kill it in Q4. PSV, PS3, and WiiU are the only other relavent consoles here, and despite WiiU's poor sales, it's selling moderately well compared to the PS3 and PSV. As for the rest, DS is obsolete, VGC gives weekly sales figures between 20-40 units, which I'm sure out outside of the tracking capaibilities of VGC. PSP and 360 also saw large drops compared to 2012 because of their slow phasing out (PSP is getting less and sell games, most devs are finally switching to PSV).

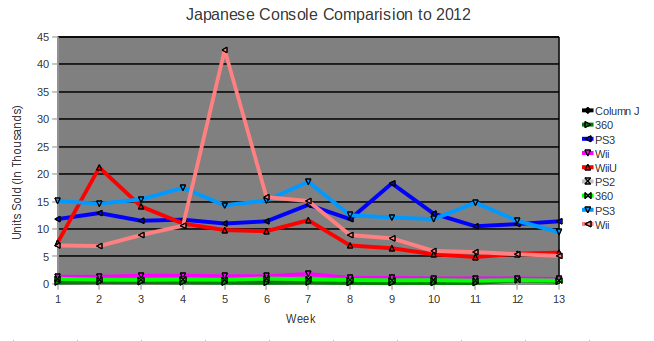
Column J is PS2 currently, sorry for the error. I removed PS2 data from the graph, but forgot to remove the line, I should have proof read.

Platform Q3 2012 Sales Q3 2013 Sales % Difference Market Share
PS3 0.182 0.160 million -12.2% 88.9%
WiiU N/A 0.120 million N/A 100% - 8th Gen
Wii 0.146 million 0.016 million -88.9% 9%
360 0.0099 million 0.0038 million -61.6% 2.1%

Wii saw a near 90% drop in sales, and for good reason. Look at the above graph, see that large pink peak? That was Dragon Quest X, the last major Wii exclusive in Japan. Since last year, the system has been slowly becoming obsolete. PS3 on the other hand has been holding it's ground, since Japanese developers are still developing PS3 games. JoJo was responsible for the late August jump over 2012 sales. 360 is just dead.

Platform Q3 2012 Sales Q3 2013 Sales % Difference Market Share
3DS 1.112 million 1.174 million +4.8% 87.4% - 8th Gen
PSV 0.181 million 0.170 million -6.0% 12.6% - 8th Gen
PSP 0.163 million 0.045 million -55.1% 99.4%
DS 0.015 million 0.0004 million -97.1% 0.6%

While 3DS saw strong sales in Q3 2012 in Japan, Monster Hunter 4, alongside a strong software lineup was enough to keep 3DS up YoY. In fact, with Pokemon in October 3DS is currently up YoY in Japan overall, with a gap likely to form. Vita only dropped 6%, and also looks hopeful in the upcoming months with the Vita Slim and Vita TV.DS however is obsolete, and Nintendo has announced plans to discontinue the console by years end. PSP likely won't remain long as almost no software is planned for the console in Japan


What is with all the hate? Don't read GamrReview Articles. Contact me to ADD games to the Database
Vote for the March Most Wanted / February Results

What to expect for Q4

PS3 surpassed the 360 in Q2 2013. The gap between PS3 and 360 will likely grow as PS3 continues to receive support from Sony and Japanese developers, where 360 has been largely abandoned by Microsoft, and the poor XB One debut has hurt the brands reputation. Expect both consoles to overtake PSP and maybe even GBA during Q4. Don't expect PS3 and 360 to keep up with their sales level last year, Q3 values are only high because of GTAV, and with the release of PS4/XB One, PS3/360 sales will likely suffer. Expect 360 to overtake Wii in North America, and PS3 to overtake Wii in Europe.

WiiU could do really bad or really good in Q4, it's too early to tell. The price cut and Wind Waker bundle have helped the WiiU outside of Japan, but inside of Japan WiiU never saw a price cut and is struggling. Wii Fit U will likely boost sales, but not as much as Wii Fit did for the Wii. It's very likely that WiiU will have weak sales until the launch of Super Mario 3D Worlds, which will likely place WiiU sales above the Gamecube at the very least. Expect moderate sales from WiiU, and WiiU to top 360 sales in Japan.

VGC give PS1 a 104.25 million units sold value for PS1, but I have no clue where they obtained it. VGC had it at 102.49 for the longest time, the same confirmed value by Sony, and the same value listed on Wikipedia, so I assume this is an error. Regardless, Wii is only 2.26 million from that goal, but if Wii only sells 40% as well as it did in Q4 2012, then Wii will still be 1.26 million behind PS1. It's difficult to say if Wii will ever outsell the PS1, it's very likely that Wii will come short of PS1 much like DS came short of PS2. Expect Wii to sell about 1 million units in Q4 2013 and creep up on PS1 total sales figures over the next 12 months.

DS is done, but PSP still has life. If PSP continues to sell 66% as well as it did last year (it probably won't though) that means PSP will gain 1.1 million units. Since the PSP to GBA gap is only 1.63 million, this means that it's very likely that PSP will outsell the GBA in 2014. Expect PSP to outsell GBA in 2014.

PSV.....I have no clue, hope and pray, competition makes better games and if PSV goes, then Nintendo might not put as much effort into their handheld games. PSV should be okay in 2014 thanks to the PSV Slim, the WW price cut, and the Vita TV launching in Japan.

3DS however is the most interesting story. Currently it's 9.9% behind itself in 2012, however this gap was only 3% at the start of the quarter. Despite the launch of the 3DS last year, 3DS has managed to keep up with itself. With 3DS selling better YoY now thanks to Monster Hunter in Japan, and Pokemon & 2DS in the rest of the world, this gap will likely disappear as early as this month! Expect 3DS sales to grow, and be the only console with a Year on Year growth.

Best Selling Video Game Consoles

The following section shows Hardware sales up to the last week of September in 2013. Bolded are the increase in sales for currently selling consoles. I will bold the entire row when one console overtakes another in overall place

Note: Release Dates are for North America, the bolded values beside some consoles represent the number of units sold since the last update.

1 – 157.68 million - Sony Playstation 2 (October 26th, 2000)
2 – 154.78 million - Nintendo DS (November 21st, 2004)
(Plus 0.30 million)
3 – 118.69 million - Nintendo Gameboy and Gameboy Color (GB-August 1989, GBC-November 1998)
4 – 102.49 million - Sony Playstation (September 9th, 1995)
5 – 100.23 million - Nintendo Wii (November 19th, 2006) (Plus 0.26 million)
6 – 81.51 million - Nintendo Gameboy Advance (June 11th, 2001)
7 – 79.88 million - Sony Playstation Portable (March 24th, 2005) (Plus 0.54 million)
8 – 79.73 million - Sony Playstation 3 (November 11th 2006) (Plus 1.65 million)
9 – 78.73 million - Microsoft X-Box 360 (November 22nd, 2005) (Plus 0.94 million)
10 – 61.91 million - Nintendo Entertainment System (US-October 18th, 1985, Can-February 1986)
11 – 49.10 million - Super Nintendo Entertainment System (August 13th 1991)
12 – 34.46 million – Nintendo 3DS (March 27th, 2011) (Plus 2.17 million)
13 – 32.93 million - Nintendo 64 (September 29th, 1996)
14 – 29.54 million - Sega Mega Drive/Genesis (August 14th, 1989)
15 – 27.64 million - Atari 2600 (October, 1977)
16 – 24.65 million - Microsoft X-Box (November 15th, 2001)
17 – 21.74 million - Nintendo Gamecube (November 18th, 2001)
18 – 13.00 million - Sega Master System (October 1986)
19 – 10.62 million - Sega GameGear (1991)
20 – 10.00 million - Nippon Electric Company TurboGrafx-16 (August 29th, 1989)
21 – 8.82 million - Sega Saturn (May 11th 1995)
22 – 8.20 million - Sega Dreamcast (September 9th, 1999)
23 – 6.00 million - Coleco ColecoVision (August 1982)
24 – 6.00 million - Sega CD (October 15th 1992)
25 – 5.78 million – Playstation Vita (February 15th, 2012) (Plus 0.25 million)
26 - 4.30 million – Atari 7800 (June 1984)
27 – 3.59 million - Nintendo WiiU (November 18th, 2012) (Plus 0.38 million)
28 – 3.00 million – Color TV Game (1977)
28 – 3.00 million - Mattel Intellivision (1980)
28 – 3.00 million - Nokia N-Gage (October 7th, 2003)
31 – 2.00 million - Panasonic 3DO Interactive Multiplayer (September 1993)
31 – 2.00 million - SNK Neo-Geo Pocket, and Neo-Geo Pocket Colour (1998)
33 – 1.50 million - Nippon Electric Company TurboExpress (1990)
34 - 1.12 million – Namco Bandai WonderSwan (1999)
35 – 1.00 million - Sega Nomad (October 1995)
36 - 0.77 million - Nintendo Virtual Boy (August 14th 1995)
37 - 0.57 million - Phillips CDi (1991)
38 - 0.50 million - Atari Lynx (September 1989)
39 - 0.30 million - Tiger Electronics Game.com (September 1997)
40 - 0.25 million - Atari Jaguar (November 18th 1993)
41 - 0.20 million - Sega 32X (November 1994)
42 - 0.042 million - Apple Pippin (1995)
43 - 0.025 million - Tiger Telematics Gizmondo (March 19th 1995)
44 - 0.015 million - Nintendo 64 Disk Drive (December 1st 1999- Japan Only)


Current Generation Regional Console Sales

USA

152.45 million - Nintendo DS (Plus 0.11 million)
2 –
49.11 million – Sony PS2 - 6th Gen
3 – 40.90
million - Nintendo Wii (Plus 0.13 million)
4 – 39.24
million - Xbox 360 (Plus 0.38 million)
5
24.19 million - Sony PS3 (Plus 0.30 million)
6 – 19.65 million - Sony PSP (Plus 0.02 million)
7 – 8.24 million – Nintendo 3DS (Plus 0.62 million) - 8th Gen

8 – 1.27 million – Sony PSV – (Plus 0.03 million) - 8th Gen
9 – 1.12 million – Nintendo WiiU – (Plus 0.03 million) - 8
th Gen

Europe

1 – 54.08 million – Sony PS2 - 6th Gen
2 – 52.07 million - Nintendo DS (Plus 0.02 million)
3 – 33.35 million - Nintendo Wii (Plus 0.17 million)
4 – 31.90 million - Sony PS3 (Plus 0.68 million)
6 – 24.68 million - Xbox 360 (Plus 0.23 million)
5 – 23.70 million - Sony PSP (Plus 0.04 million)
7 – 9.20 million – Nintendo 3DS (Plus 0.77 million) - 8th Gen

8 – 1.88 million – Sony PSV – (Plus 0.06 million) - 8th Gen
9 – 0.76 million – Nintendo WiiU – (Plus 0.13 million) - 8
th Gen

Japan

1 – 33.01 million - Nintendo DS
2 – 23.18 million – Sony PS2 - 6th Gen
3 – 19.86 million - Sony PSP (Plus 0.22 million)
6 – 12.93 million – Nintendo 3DS (Plus 1.39 million) - 8th Gen
4 – 12.74 million - Nintendo Wii (Plus 0.03 million)
5 – 9.52 million - Sony PS3 (Plus 0.29 million)
8 – 1.81 million – Sony PSV (Plus 0.33 million) - 8th Gen
7 - 1.65 million - Xbox 360 (Minus 0.01 million)
9 – 1.08 million – Nintendo WiiU (Plus 0.22 million) - 8th Gen


What is with all the hate? Don't read GamrReview Articles. Contact me to ADD games to the Database
Vote for the March Most Wanted / February Results

Around the Network

I'm going to make a software update next week. It will be in a similar style to this, except I will have a tables comparing the best video games ever made, within the 7th/8th generation, 8th generation alone, and for individual platforms who have games that still sell.

Just got a busy couple days ahead of me, these articles takes a while to publish.


What is with all the hate? Don't read GamrReview Articles. Contact me to ADD games to the Database
Vote for the March Most Wanted / February Results

Nicely done. It's quite interesting how slowly platforms climb in the best-selling consoles ranking even on a quarterly basis


Tagged for read later


Little Heart Symbol


Tagged. I'm in class right now. I'll check it later.