| Mbolibombo said: Cool charts. I honestly though Switch versions of a few games would sell lesser than what these show. Considering many of them released at a later date than the initial launch and a lot smaller user base. PS4 as expected sells the most of almost everything which is not very surprising considering how many users they have. Of the day and day releases Switch seems to do pretty ok after all. If we consider revenue for many of these late ports, I am sure that publishers in many instances are still pretty pleased with sales for some of the late ports. Fighterz is going to be interesting, while I do not expect the Switch version to come close to the PS4 version I fully expect it to be a big seller. Another interesting game will be Disgaea 1 Complete that will release day and day between NSW and PS4. Well done OP. |
Yeah, Switch-versions do often not bad. What is more interesting: the split between PS4 and Xbox seems more even, it has smaller differences with different games. But with Switch it wildly fluctuates. Some games like South Park or FIFA have a really small market share, others like Sonic, Resident Evil, Attack on Titan or Disgaea have a real big market share. This clearly shows that the userbase of PS4 and XBox is pretty similar, while the Switch has a very different userbase.
| DonFerrari said: Thought there had been an update on the OP. But still the greatest point this show is that SW sales aren't that correlated with HW sales to people that still believe in constant attach ratios. |
Yes, this is something I again and again say. Sure, a bigger install base usually leads to bigger sales. But it is far from a linear connection, often even a negligable difference. A fan of Monster Hunter gets Monster Hunter, regardless of the platform. The only reason for smaller sales on smaller install bases might be a reluctance to get said platform for just one game.
A few games though grow more with the install base. Seemingly few buy a Nintendo platform for Mario Kart, but many buy Mario Kart if they own a Nintendo platform. So this is a game that grows with the userbase. But even for Mario Kart it is far from linear, and I think there are very few games like that.
DonFerrari said:
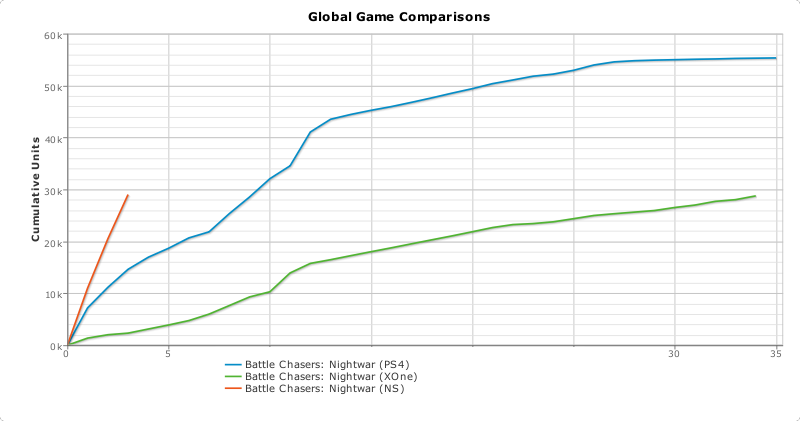
Unless this very steep curve for the NS version decelerate soon it will have more than 50% of the sales very soon. |
Yeah, this sales curve is kinda strange. Most of it is done in the US, in europe Battlechasers sells on Switch around the same as the PS4-version and has the same dropoff. In the US the sales are really big and more baffling stay nearly constant. I don't know the reason, maybe ads?
| leo-j said: 40 percent of games sold on PS4 are digital, so add a nice 35-40 percent to it's software numbers to make this more accurate please. |
Oh no. This demand is flawed on so many levels. First of all, it ignores digital sales on other platform, as if Playstation is the only platform with digital sales. Secondly this changes over time, a recent post in a thread here showed, that these numbers are increasing over time. Third, the ratio often includes digital only titles, which inflates the ratio that in result cannot be applied to games that release both physical and digital. Fourth, the digital ratio also fluctuates strongly between different titles. So do Monster Hunter World and Octopath Traveler have a higher digital ratio, because they were initially undershipped.
So in conclusion: if you have data that shows digital sales for the games for ALL platforms (not include PS4-sales digital, but has Xbox only physical or so), then we can make graphs based on that data. As long I can only map data which we have. You have to apply your usual consideration regarding VGC-estimates of physical sales.


