Quater 4 Analysis
By: Michael-5
Hey guys, thanks for reading my Quarterly analysis. For those unfamiliar with my quarterly analysis's here are link to my older analysis's. Q3 and Prior I merged hardware and software, but I found that to be info overload, so I separated Hardware/Software.
Quarter 4 2012
Quarter 3 2012
Quarter 2 2012
Quarter 3 2010
GameTrailers Archive
I used to make these on GameTrailers before and when I first joined VGC, but now I have kind of migrated here. There is a gap between 2010 and 2012, but it's only because I would write these articles up, but never publish them.
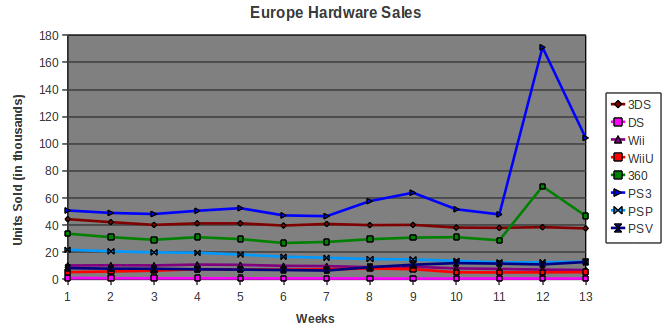
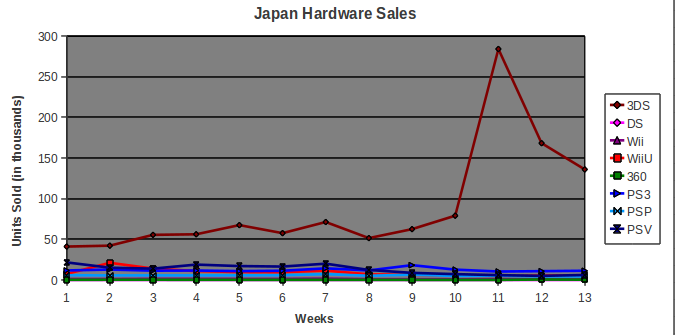
To save me time, I numbered the 13 weeks 1-13 on the charts, and they correspond to the first week of July up the the last week of September for the respective year. Also note that the top lines for consoles represent current quarter sales, and the bottom lines represent past sales (i.e. 3DS is bright red for 2013, dark red for 2012. PS3 is Dark Blue in 2013, and Cyan in 2012, etc).
I also asked TrunkSwd if I could write these as articles on VGC, but haven't received an answer yet. So, if you like this, and think it's as good or better then VGC's own articles, go spam message him or other Administrators.
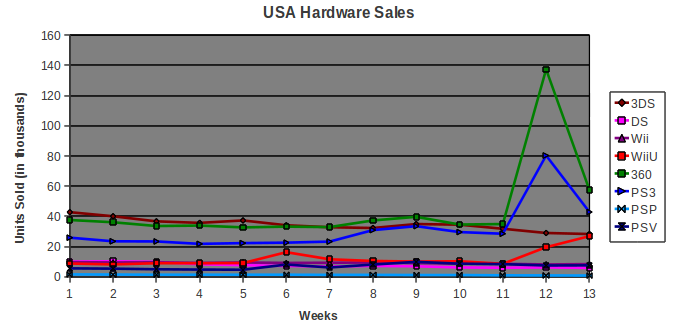
Anyway, lets begin with graphs showing hardware sales for all platforms in all regions, the graphs should be self explanitory
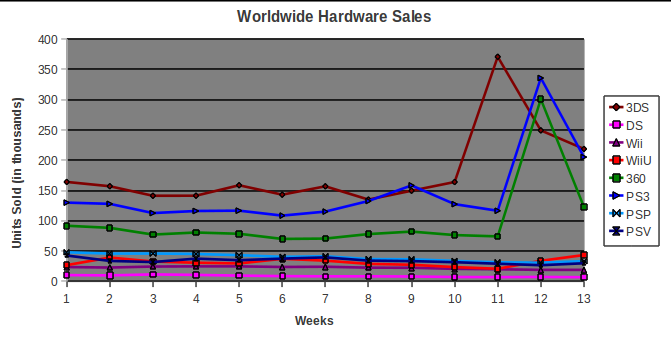
| Platform | Q3 Sales |
| 3DS | 2.35 million |
| PS3 | 1.90 million |
| 360 | 1.30 million |
| PSP | 0.51 million |
| PSV | 0.44 million |
| WiiU | 0.41 million |
| Wii | 0.29 million |
| DS | 0.11 million |
3DS was the best selling system WW for Q3 2013, followed by PS3, and then 360. Since the One reveal, 360 sales have struggled to keep up with PS3 sales, to the point where a new Slim model didn't even boost sales (note a marginal boost for PS3 in early September). WiiU and PSV have been struggling, but with the price cut and Wind Waker bundle launched in October, sales for Q4 look hopeful for WiiU. PSV still has a hard battle, but anything can happen Q4.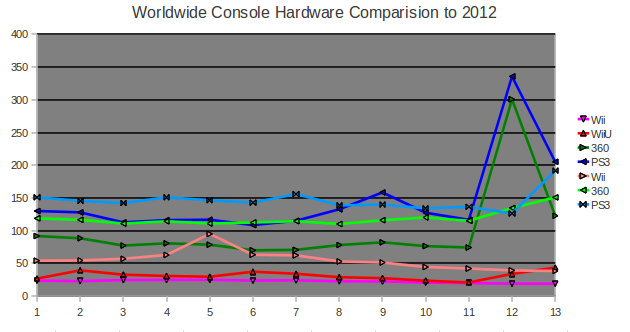
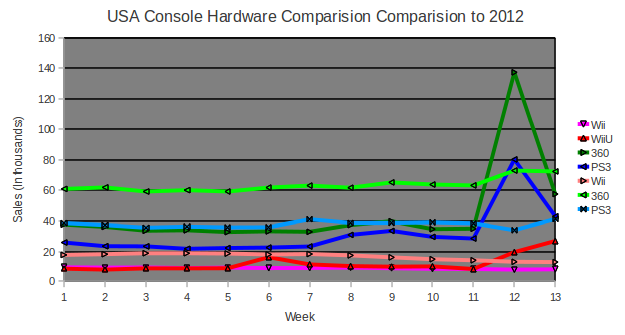
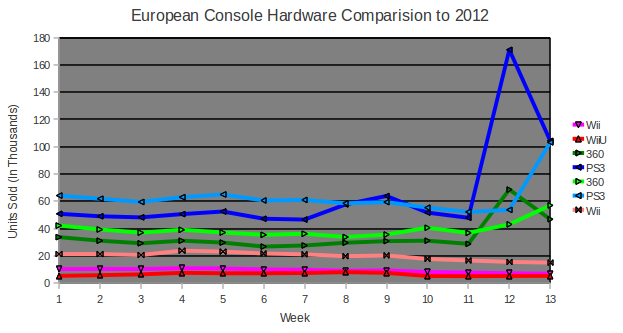
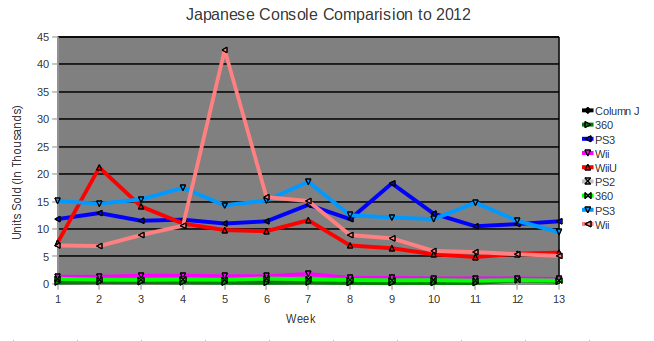
The first console labeled in the legend represents 2013 sales, the second represents 2012 sales. E.g. PS3 is Dark Blue in 2013, and Cyan in 2012.
| Platform | Q3 2012 Sales | Q3 2013 Sales | % Difference | Market Share |
| PS3 | 1.90 million | 1.90 million | -0.1% | 54.6% |
| 360 | 1.54 million | 1.29 million | -16.4% | 37% |
| WiiU | N/A | 0.41 million | N/A | 100% -8th Gen |
| Wii | 0.72 million | 0.29 million | -59.3% | 8.4% |
Due to Grand Theft Auto, 360 sales aren't down too much this quarter, and PS3 has kept even. Wii sales have crashed though, which is expected since the last 1st party game released over a year ago.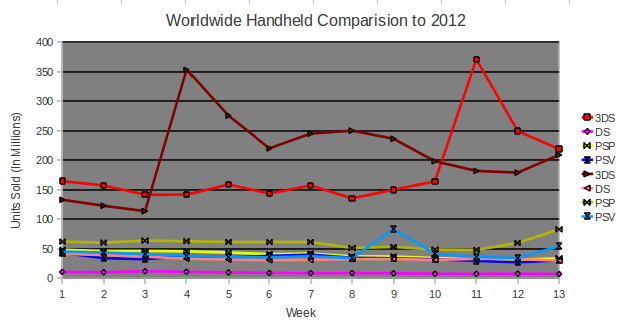
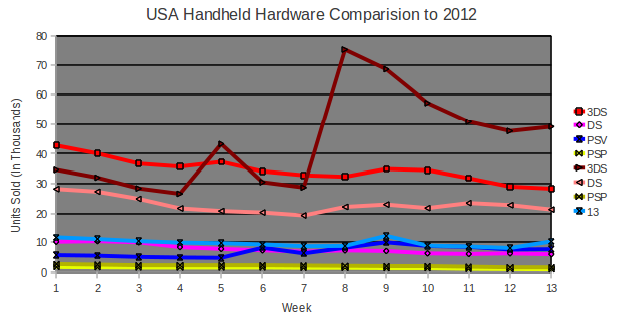
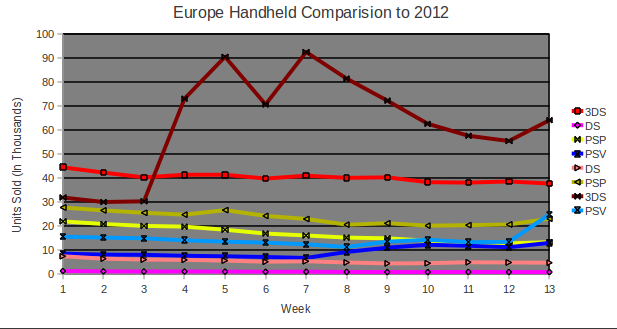
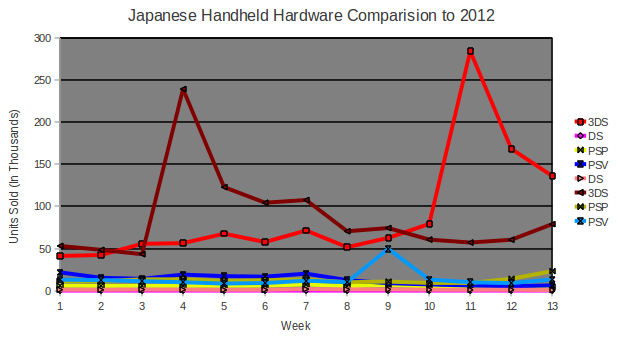
The first console labeled in the legend represents 2013 sales, the second represents 2012 sales. E.g. 3DS is Dark Red in 2012 and Bright Red in 2013.
| Platform | Q3 2012 Sales | Q3 2013 Sales | % Difference | Market Share |
| 3DS | 2.72 million | 2.35 million | -13.4% | 86.6% - 8th Gen |
| PSP | 0.77 million | 0.51 million | -33.6% | 66.4% |
| PSV | 0.56 million | 0.44 million | -20.2% | 13.4% - 8th Gen |
| DS | 0.43 million | 0.11 million | -73.5% | 33.6% |
3DS sales are interesting to track because despite being down 13.4% this quarter, this doesn't imply that 3DS won't be up YoY. 3DS had a hard battle since Q1&2 sales of 2012 were high due to the $80 price cut in 2011, and Q3 sales are down because of the release of the 3DS XL in 2012. However with the release of Monster Hunter 4 in Japan and Pokemon worldwide, there is a good chance 3DS can make up the small 13% gap (for the entire year). PSV numbers however are less hopeful, not only is it down 20% from last year (likely because Persona pushed sales in 2012), they are still below PSP numbers a year and a half after release. Q4 will be interesting as they will see if how well 3DS will do, if Vita has hope, and where DS will peak at.
What is with all the hate? Don't read GamrReview Articles. Contact me to ADD games to the Database 
Vote for the March Most Wanted / February Results