By using this site, you agree to our Privacy Policy and our Terms of Use. Close

Forums - General - Increased Number Think Global Warming Is “Exaggerated”

Kasz216 said:
theRepublic said:
Kasz216 said:

Nobody is denying global warming. It's presenting actual facts that it's not man made.

Seriously... i've yet to see a refutation that 95% of global warming is Water Vapor caused.

Seriously... argue this Highwayman. What's your rebuttle?

It's not like Earth has always been the same tempeture and climate up until Earth came on the scene.

http://gristmill.grist.org/story/2006/12/22/222357/40

Objection: H2O accounts for 95% of the greenhouse effect; CO2 is insignificant.

Answer: According to the scientific literature and climate experts, CO2 contributes anywhere from 9% to 30% to the overall greenhouse effect. The 95% number does not appear to come from any scientific source, though it gets tossed around a lot.


Please see this paper (PDF), the textbook referenced here, and this article at RealClimate.


There is a very important distinction to be made, as you will read if you follow the link to Real Climate, between water vapour's role in the Earth's Greenhouse effect and it's role in climate change. If you were to read through the table of climate forcings in the IPCC report or at NASA's page about forcings in its GCM, you won't find water vapour there at all. This is not because climate scientists are trying to hide the role of water vapour, rather it is because H2O in the troposphere is a feedback effect, it is not a forcing agent. Simply put, any artificial perturbation in water vapour concentrations is too short lived to change the climate. Too much in the air will quickly rain out, not enough and the abundant ocean surface will provide the difference via evaporation. But once the air is warmed by other means, H2O concentrations will rise and stay high, thus providing the feedback.

I quoted a scientific source... a direct scientific study.

As for the IPCC report.  That's the same one a number of scientists quit and refused to sign their names too because they said the lead scientists were misrepresenting and fudging data for politcal reasons... right?


"H2O in the troposphere is a feedback effect, it is not a forcing agent. Simply put, any artificial perturbation in water vapour concentrations is too short lived to change the climate. Too much in the air will quickly rain out, not enough and the abundant ocean surface will provide the difference via evaporation. But once the air is warmed by other means, H2O concentrations will rise and stay high, thus providing the feedback."

http://www.realclimate.org/index.php?p=142

Water vapour: feedback or forcing?
Filed under: FAQ Climate modelling Greenhouse gases Climate Science — gavin @ 7:51 PM - ()

Whenever three or more contrarians are gathered together, one will inevitably claim that water vapour is being unjustly neglected by 'IPCC' scientists. "Why isn't water vapour acknowledged as a greenhouse gas?", "Why does anyone even care about the other greenhouse gases since water vapour is 98% of the effect?", "Why isn't water vapour included in climate models?", "Why isn't included on the forcings bar charts?" etc. Any mainstream scientist present will trot out the standard response that water vapour is indeed an important greenhouse gas, it is included in all climate models, but it is a feedback and not a forcing. From personal experience, I am aware that these distinctions are not clear to many, and so here is a more in-depth response (see also this other attempt).


First some basics. Long-wave (or thermal) radiation is emitted from the surface of the planet and is largely absorbed in the atmosphere. Water vapour is the principle absorber of this radiation (and acknowledged as such by everybody). But exactly how important is it? In terms of mass, water vapour is much more prevalent (about 0.3% of atmospheric mass, compared to about 0.06% for CO2), and so is ~80% of all greenhouse gases by mass (~90% by volume). However, the radiative importance is less (since all molecules are not created equal). One way to quantify this is to take a radiation model and remove each long-wave absorber (principally the greenhouse gases, but also clouds and aerosols) and see what difference it makes to the amount of long-wave absorbed. This gives the minimum effect from each component. The complementary calculation, using only each particular absorber in turn, gives the maximum effect. Generally these will not be equal because of overlaps in the absorbing spectra (i.e. radiation at a particular frequency can either be absorbed by water vapour or CO2).

Removed absorbers Fraction LW Rad. Forcing
absorbed Tropo. (W/m2)
None 100% 0
H2O 64 (64, RC78) -56
Clouds 84 (86, RC78) -
CO2 91 (88, RC78) -23
O3 97 (97, RC78)
Other GHG 98 -3
H2O+Clouds 34 -
H2O+CO2 47 -89
All except H2O+Clouds 85 -
All except H2O  66 (60-70, IPCC90) -
All except CO2  26 (25, IPCC90) -
All except O3 7 -
All except Other GHG 8 -
All 0% -
Instant calculation, global mean, Jan. 1, 1979 RC78=Ramanathan and Coakley (1978)
'All' includes aerosols, O3 and other minor gases as additional absorbers.


The table shows the instantaneous change in long-wave aborption when each component or combination of components is removed using the radiation code from the GISS GCM. (The source code is available for those who have the patience to get it to work). This isn't a perfect calculation but it's quick and easy and is close enough to the right answer for our purposes. (N.B. This is very similar to what was done by Ramanathan and Coakley (1978) using a single column model - their numbers are in the table for reference). Because of the overlaps, the combined changes are larger than the changes due to each individual component. Another calculation is the instantaneous radiative forcing at the tropopause, but that is complicated for clouds, O3 and Aerosols which have impacts on solar radiation as well as the long wave, so I only give that value for the 'pure' greenhouse gases.

The overlaps complicate things, but it's clear that water vapour is the single most important absorber (between 36% and 66% of the greenhouse effect), and together with clouds makes up between 66% and 85%. CO2 alone makes up between 9 and 26%, while the O3 and the other minor GHG absorbers consist of up to 7 and 8% of the effect, respectively. The remainders and uncertainties are associated with the overlaps which could be attributed in various ways that I'm not going to bother with here. Making some allowance (+/-5%) for the crudeness of my calculation, the maximum supportable number for the importance of water vapour alone is about 60-70% and for water plus clouds 80-90% of the present day greenhouse effect. (Of course, using the same approach, the maximum supportable number for CO2 is 20-30%, and since that adds up to more than 100%, there is a slight problem with such estimates!).

Since we are looking at the whole of the present-day greenhouse effect (around 33 C), it is not surprising that the radiative forcings are very large compared to those calculated for the changes in the forcing. The factor of ~2 greater importance for water vapour compared to CO2 is consistent with the first calculation.

So where does the oft quoted "98%" number come from? This proves to be a little difficult to track down. Richard Lindzen quoted it from the IPCC (1990) report in a 1991 QJRMS review* as being the effect of water vapour and stratiform clouds alone, with CO2 being less than 2%. However, after some fruitless searching I cannot find anything in the report to justify that (anyone?). The calculations here (and from other investigators) do not support such a large number and I find it particularly odd that Lindzen's estimate does not appear to allow for any overlap.


While water vapour is indeed the most important greenhouse gas, the issue that makes it a feedback (rather than a forcing) is the relatively short residence time for water in the atmosphere (around 10 days). To demonstrate how quickly water reacts, I did a GCM experiment where I removed all the water in the atmosphere and waited to see how quickly it would fill up again (through evaporation from the ocean) . The result is shown in the figure. It's not a very exciting graph because the atmosphere fills up very quickly. At Day 0 there is zero water, but after only 14 days, the water is back to 90% of its normal value, and after 50 days it's back to within 1%. That's less than 3 months. Compared to the residence time for perturbations to CO2 (decades to centuries) or CH4 (a decade), this is a really short time.


Only the stratosphere is dry enough and with a long enough residence time (a few years) for the small anthropogenic inputs to be important. In this case (and in this case only) those additions can be considered a forcing. Oxidation of anthropogenic methane (which is a major source of stratospheric water) and, conceviably, direct deposition of water from increases in aircraft in the lower stratosphere, can increase stratospheric water and since that gives a radiative forcing effect, they do appear on the forcings bar chart (under "H2O from CH4"). Some scientists have argued that changes to irrigation and other land use changes (which effect evaporation) are also direct forcings to water vapour amounts, but I think it's cleaner to think of that as an indirect water vapour response to the change.

When surface temperatures change (whether from CO2 or solar forcing or volcanos etc.), you can therefore expect water vapour to adjust quickly to reflect that. To first approximation, the water vapour adjusts to maintain constant relative humidity. It's important to point out that this is a result of the models, not a built-in assumption. Since approximately constant relative humidity implies an increase in specific humidity for an increase in air temperatures, the total amount of water vapour will increase adding to the greenhouse trapping of long-wave radiation. This is the famed 'water vapour feedback'. A closer look reveals that for a warming (in the GISS model at least) relative humidity increases slightly in the tropics, and decreases at mid latitudes.

How do we know that the magnitude of this feedback is correctly simulated? A good test case is the response to the Pinatubo eruption. This caused cooling for up to 3 years after the eruption - plenty of time for water vapour to equilibriate to the cooler sea surface temperatures. Thus if models can simulate the observed decrease of water vapour at this time, it would be a good sign that they are basically correct. A good paper that demonstrated this was Soden et al (2002) (and the accompanying comment by Tony DelGenio). They found that using the observed volcanic aerosols as forcing the model produced very similar cooling to that observed. Moreover, the water vapour in the total column and in the upper troposphere decreased in line with satellite observations, and helped to increase the cooling by about 60% - in line with projections for increasing greenhouse gases.

To be sure there are still some lingering uncertainties. Some recent data indicates that tropical upper tropopsheric water vapour does not quite keep up with constant relative humidity (Minschwaner and Dessler, 2004) (though they still found that the feedback was positive). Moist convection schemes in models are constantly being refined, and it's possible that newer schemes will change things . However, given the Pinatubo results, the models are probably getting the broader picture reasonably correct.

*R.S. Lindzen, 1991. Quart. J. Roy. Met. Soc., 117, pp. 651-652


Switch Code: SW-7377-9189-3397 -- Nintendo Network ID: theRepublic -- Steam ID: theRepublic

Now Playing
Switch - Super Mario Maker 2 (2019)
3DS - Phoenix Wright: Ace Attorney (Trilogy) (2005/2014)
Mobile - Yugioh Duel Links (2017)
Mobile - Super Mario Run (2017)
PC - Borderlands 2 (2012)
PC - Deep Rock Galactic (2020)

Around the Network

Kasz216 said:

You didn't sound like a dickhead... just uninformed.

These models don't leave out unknown factors.  They leave out very known factors that would screw up there theories.

Why?

2 reasons mainly.

1) It's a good motivator.

Just about everything that could "stop" global warming is something people should be doing anyway for their countries benefit.  So why do credibly research when we can freak them out and make them do this faster.

2) It costs a lot of time and money to become a scientist.  If you don't believe in global warming... it's going to be awful hard to get a job.... nobody is going to fund you, and even if you have proof your going to be labeled a liar and that you were paid off to do your study.

So between keeping your integrety and getting a big payoff... well it's a no brainer when you've spend 6-8 years of your life dedicated to doing something.


The biggest factor to global warming?  Water Vapor.

"Freidenreich and colleagues  have reported the overlap of carbon dioxide and water absorption bands in the infrared region. Given the present composition of the atmosphere, the contribution to the total heating rate in the troposphere is around 5 percent from carbon dioxide and around 95 percent from water vapor."

So... where we are... it's 95% water vapor.

So you see... this is why Global Warming is natural.

Water Vapor causes global warming, which causes more water vapor, which causes global warming, which causes more water vapor etc.

Unless something comes in and breaks the cycle.

So for every 20 degrees of tempeture increase.  Carbon Dioxide is repsonsible for 1 degree.

Ignoring the fact that most Carbon Dioxide isn't even manmade.

Furthermore of man made Carbon Dioxide the number 1 source is farming animals for meat.

I don't see any "Go vegetarian" cries from the general populus and government... why?  Because it doesn't benfit the country like energy independence and less spent on gas lowering the trade gap.

Even though it would be easier for people to cut down on meat and more helpful for the enviroment.

It would also greatly help the global food crisis.

http://skepticdebunk.blogspot.com/2007/10/global-warming-closer-look-at-numbers.html

Error: 95% attribution of Water Vapor to greenhouse effect
This one is actually more an error with the DOE site. One of the references the skeptic websites makes for the 95% figure is to this DOE page:
http://www.eia.doe.gov/cneaf/alternate/page/environment/appd_d.html

Which says (emphasis mine):
"Freidenreich and colleagues [106] have reported the overlap of carbon dioxide and water absorption bands in the infrared region. Given the present composition of the atmosphere, the contribution to the total heating rate in the troposphere is around 5 percent from carbon dioxide and around 95 percent from water vapor. In the stratosphere, the contribution is about 80 percent from carbon dioxide and about 20 percent from water vapor."

The DOE site sources the paper:
S.M. Freidenreich and V. Ramaswamy, “Solar Radiation Absorption by Carbon Dioxide, Overlap with Water, and a Parameterization for General Circulation Models,” Journal of Geophysical Research 98

However this is a mix up. The paper is about absorption of solar radiation, not longwave radiation emitted from the Earth (some solar radiation is actually in the IR spectrum - yea everything is more complex than it seems). The 95% water vapor figure is for absorption of incoming solar radiation (or part of it), not outgoing longwave radiation.

The mix up is made clearer by the presence of the Table D2 on that DOE page, which contradicts what they just wrote:

Table D2. Efficiency of Heat Trapping by Greenhouse Gases and Clouds
Species Removed Percentage Heat Trapped Percentage Heat Not Trapped
Alla 0 100
H2O, CO2, O3 50 50
H2O 64 36
Clouds 86 14
CO2 88 12
O3 97 3
None 100 0

CO2 = Carbon dioxide. H2O = Water vapor. O3 = Ozone.
aIncludes clouds.
Source: V. Ramanathan and J.A. Coakley, Jr., “Climate Modeling
Through Radiative-Convective Models,” Review of Geophysics & Space Physics 16 (1978):465.


The table shows that if all water vapor was removed from the atmosphere the greenhouse effect would be diminished by only a third. Of course that's leaving out clouds which come as part of the package with water vapor.

The above table is extended by the previously linked realclimate article to include the effect of removing both clouds and water vapor:
http://www.realclimate.org/index.php?p=142

This indicates that removal of both clouds and water vapor would result in a loss 0f about two thirds of the greenhouse effect. Wheras removal of everything except clouds and water vapor results in a loss of about 15% of the greenhouse effect. So the contribtion of water vapor (inc clouds) to the greenhouse effect is between 66% to 85%. Which leads to a general flaw with what the skeptic website is trying to do:

Flaw: It's incorrect to express the contribution of a greenhouse gas to the greenhouse effect as a specific percentage.
Because the contributions overlap.


Switch Code: SW-7377-9189-3397 -- Nintendo Network ID: theRepublic -- Steam ID: theRepublic

Now Playing
Switch - Super Mario Maker 2 (2019)
3DS - Phoenix Wright: Ace Attorney (Trilogy) (2005/2014)
Mobile - Yugioh Duel Links (2017)
Mobile - Super Mario Run (2017)
PC - Borderlands 2 (2012)
PC - Deep Rock Galactic (2020)

people don't seem to understand the speed climate change will take effect. When people first started to take it seriously lots of people were worried by it, 5 years later when hardly any change has happened people stop caring as they don't get that climate change will be steadily but slowly taking effect over many years not just 5.


I think the true cause of global warming is asphalt and cement.
Historical temperaure measurements were taken in cities, increasing amounts of cement and asphalt was used in and around cities. Asphalt and cement holds more heat then grass and trees that was previously there. This skews temperatures, making it look like they are going up. Instad it is just the heat island effect.

"An urban heat island (UHI) is a metropolitan area which is significantly warmer than its surrounding rural areas. The temperature difference usually is larger at night than during the day and larger in winter than in summer, and is most apparent when winds are weak. The main cause of the urban heat island is modification of the land surface by urban development; waste heat generated by energy usage is a secondary contributor."

http://en.wikipedia.org/wiki/Heat_island

Then they try to deny that isn't the case.

In any case, ground temperature measurements, like most weather observations, are logged by location; 19th-century United States air temperatures were often logged at Post Offices; early-20th-century temperatures added airfield observation sites. Both predate the massive sprawl, roadbuilding programs, and high- and medium-rise expansions contributing to UHI.

A thermostat hung on the side of a post office building will be slightly hotter because the building radiates some heat back at it. Airports are dominated by large heat absorbing asphalt runways. I bet they take temperature readings near the flapping windsock, which is near the runways. It again would get slightly higher temps because of radiated heat back at it.

Mystery solved!


Yet, today, America's leaders are reenacting every folly that brought these great powers [Russia, Germany, and Japan] to ruin -- from arrogance and hubris, to assertions of global hegemony, to imperial overstretch, to trumpeting new 'crusades,' to handing out war guarantees to regions and countries where Americans have never fought before. We are piling up the kind of commitments that produced the greatest disasters of the twentieth century.
 — Pat Buchanan – A Republic, Not an Empire

Tyrannical said:

I think the true cause of global warming is asphalt and cement.
Historical temperaure measurements were taken in cities, increasing amounts of cement and asphalt was used in and around cities. Asphalt and cement holds more heat then grass and trees that was previously there. This skews temperatures, making it look like they are going up. Instad it is just the heat island effect.

"An urban heat island (UHI) is a metropolitan area which is significantly warmer than its surrounding rural areas. The temperature difference usually is larger at night than during the day and larger in winter than in summer, and is most apparent when winds are weak. The main cause of the urban heat island is modification of the land surface by urban development; waste heat generated by energy usage is a secondary contributor."

http://en.wikipedia.org/wiki/Heat_island

Then they try to deny that isn't the case.

In any case, ground temperature measurements, like most weather observations, are logged by location; 19th-century United States air temperatures were often logged at Post Offices; early-20th-century temperatures added airfield observation sites. Both predate the massive sprawl, roadbuilding programs, and high- and medium-rise expansions contributing to UHI.

A thermostat hung on the side of a post office building will be slightly hotter because the building radiates some heat back at it. Airports are dominated by large heat absorbing asphalt runways. I bet they take temperature readings near the flapping windsock, which is near the runways. It again would get slightly higher temps because of radiated heat back at it.

Mystery solved!

Why didn't you post the whole thing?  Is it because it refutes the assertion you just made with it?

Relation to global warming

Because some parts of some cities may be several degrees hotter than their surroundings, concerns have been raised that the effects of urban sprawl might be misinterpreted as an increase in global temperature. While the 'heat island' warming is an important local effect, there is no evidence that it biases trends in historical temperature record; for example, urban and rural trends are very similar [2].

The IPCC (2001) says:
However, over the Northern Hemisphere land areas where urban heat islands are most apparent, both the trends of lower-tropospheric temperature and surface air temperature show no significant differences. In fact, the lower-tropospheric temperatures warm at a slightly greater rate over North America (about 0.28°C/decade using satellite data) than do the surface temperatures (0.27°C/decade), although again the difference is not statistically significant.[10]

Note that not all cities show a warming relative to their rural surroundings. For example, Hansen et al. (JGR, 2001) adjusted trends in urban stations around the world to match rural stations in their regions, in an effort to homogenise the temperature record. Of these adjustments, 42% warmed the urban trends: which is to say that in 42% of cases, the cities were getting cooler relative to their surroundings rather than warmer. One reason is that urban areas are heterogeneous, and weather stations are often sited in "cool islands" - parks, for example - within urban areas.

Peterson (2003) indicates that the effects of the urban heat island may have been overstated, finding that "Contrary to generally accepted wisdom, no statistically significant impact of urbanization could be found in annual temperatures." This was done by using satellite-based night-light detection of urban areas, and more thorough homogenisation of the time series (with corrections, for example, for the tendency of surrounding rural stations to be slightly higher, and thus cooler, than urban areas). As the paper says, if its conclusion is accepted, then it is necessary to "unravel the mystery of how a global temperature time series created partly from urban in situ stations could show no contamination from urban warming." The main conclusion is that micro- and local-scale impacts dominate the meso-scale impact of the urban heat island: many sections of towns may be warmer than rural sites, but meteorological observations are likely to be made in park "cool islands."

A study by David Parker published in Nature in November 2004 and in Journal of Climate in 2006 attempts to test the urban heat island theory, by comparing temperature readings taken on calm nights with those taken on windy nights. If the urban heat island theory is correct then instruments should have recorded a bigger temperature rise for calm nights than for windy ones, because wind blows excess heat away from cities and away from the measuring instruments. There was no difference between the calm and windy nights, and the author says: we show that, globally, temperatures over land have risen as much on windy nights as on calm nights, indicating that the observed overall warming is not a consequence of urban development.[14][15]

However, Roger A. Pielke has claimed that Parker 2004 has "serious issues with its conclusions" [3] due to his research published in Geophysical Research Letters which states: "if the nocturnal boundary layer heat fluxes change over time, the trends of temperature under light winds in the surface layer will be a function of height, and that the same trends of temperature will not occur in the surface layer on windy and light wind nights."[4].

Another view, often held by skeptics of global warming, is that much of the temperature increase seen in land based thermometers could be due to an increase in urbanisation and the siting of measurement stations in urban areas [5][6]. However, these views are mainly presented in "popular literature" and there are no known scientific peer-reviewed papers holding this view.[16]

The Fourth Assessment Report from the IPCC (2007: p.244) says the following.

Studies that have looked at hemispheric and global scales conclude that any urban-related trend is an order of magnitude smaller than decadal and longer time-scale trends evident in the series (e.g., Jones et al., 1990; Peterson et al., 1999). This result could partly be attributed to the omission from the gridded data set of a small number of sites (<1%) with clear urban-related warming trends. In a worldwide set of about 270 stations, Parker (2004, 2006) noted that warming trends in night minimum temperatures over the period 1950 to 2000 were not enhanced on calm nights, which would be the time most likely to be affected by urban warming. Thus, the global land warming trend discussed is very unlikely to be influenced significantly by increasing urbanisation (Parker, 2006). ... Accordingly, this assessment adds the same level of urban warming uncertainty as in the TAR: 0.006°C per decade since 1900 for land, and 0.002°C per decade since 1900 for blended land with ocean, as ocean UHI is zero.

As the 4th assessment hints, oceanic data is in hand from a wide variety of different data collection methods, taken by both civil and national defense groups, as well as multiple subsurface readings, in addition to lower-, middle-, upper-, and ultrahigh-atmosphere datasets. Ground sites themselves have also dispersed in location.

In any case, ground temperature measurements, like most weather observations, are logged by location; 19th-century United States air temperatures were often logged at Post Offices; early-20th-century temperatures added airfield observation sites. Both predate the massive sprawl, roadbuilding programs, and high- and medium-rise expansions contributing to UHI. More importantly, the logs allow sites in question to be filtered easily from data sets. Doing so, the presence of heat islands is visible, but overall trends change in magnitude, not direction.


Switch Code: SW-7377-9189-3397 -- Nintendo Network ID: theRepublic -- Steam ID: theRepublic

Now Playing
Switch - Super Mario Maker 2 (2019)
3DS - Phoenix Wright: Ace Attorney (Trilogy) (2005/2014)
Mobile - Yugioh Duel Links (2017)
Mobile - Super Mario Run (2017)
PC - Borderlands 2 (2012)
PC - Deep Rock Galactic (2020)

Around the Network

To further refute your assertion:

http://gristmill.grist.org/story/2006/10/26/224634/48

Objection: The apparent rise of global average temperatures is actually an illusion due to the urbanization of land around weather stations, the Urban Heat Island effect.


Answer: Urban Heat Island Effect has been examined quite thoroughly (PDF) and found to have a negligible effect on temperature trends. Real Climate has a detailed discussion of this here. What's more, NASA GISS takes explicit steps in their analysis to remove any such spurious signal by normalizing urban station data trends to the surrounding rural stations. It is a real phenomenon, but it is one climate scientists are well aware of and have taken any required steps to remove its influence from the raw data.

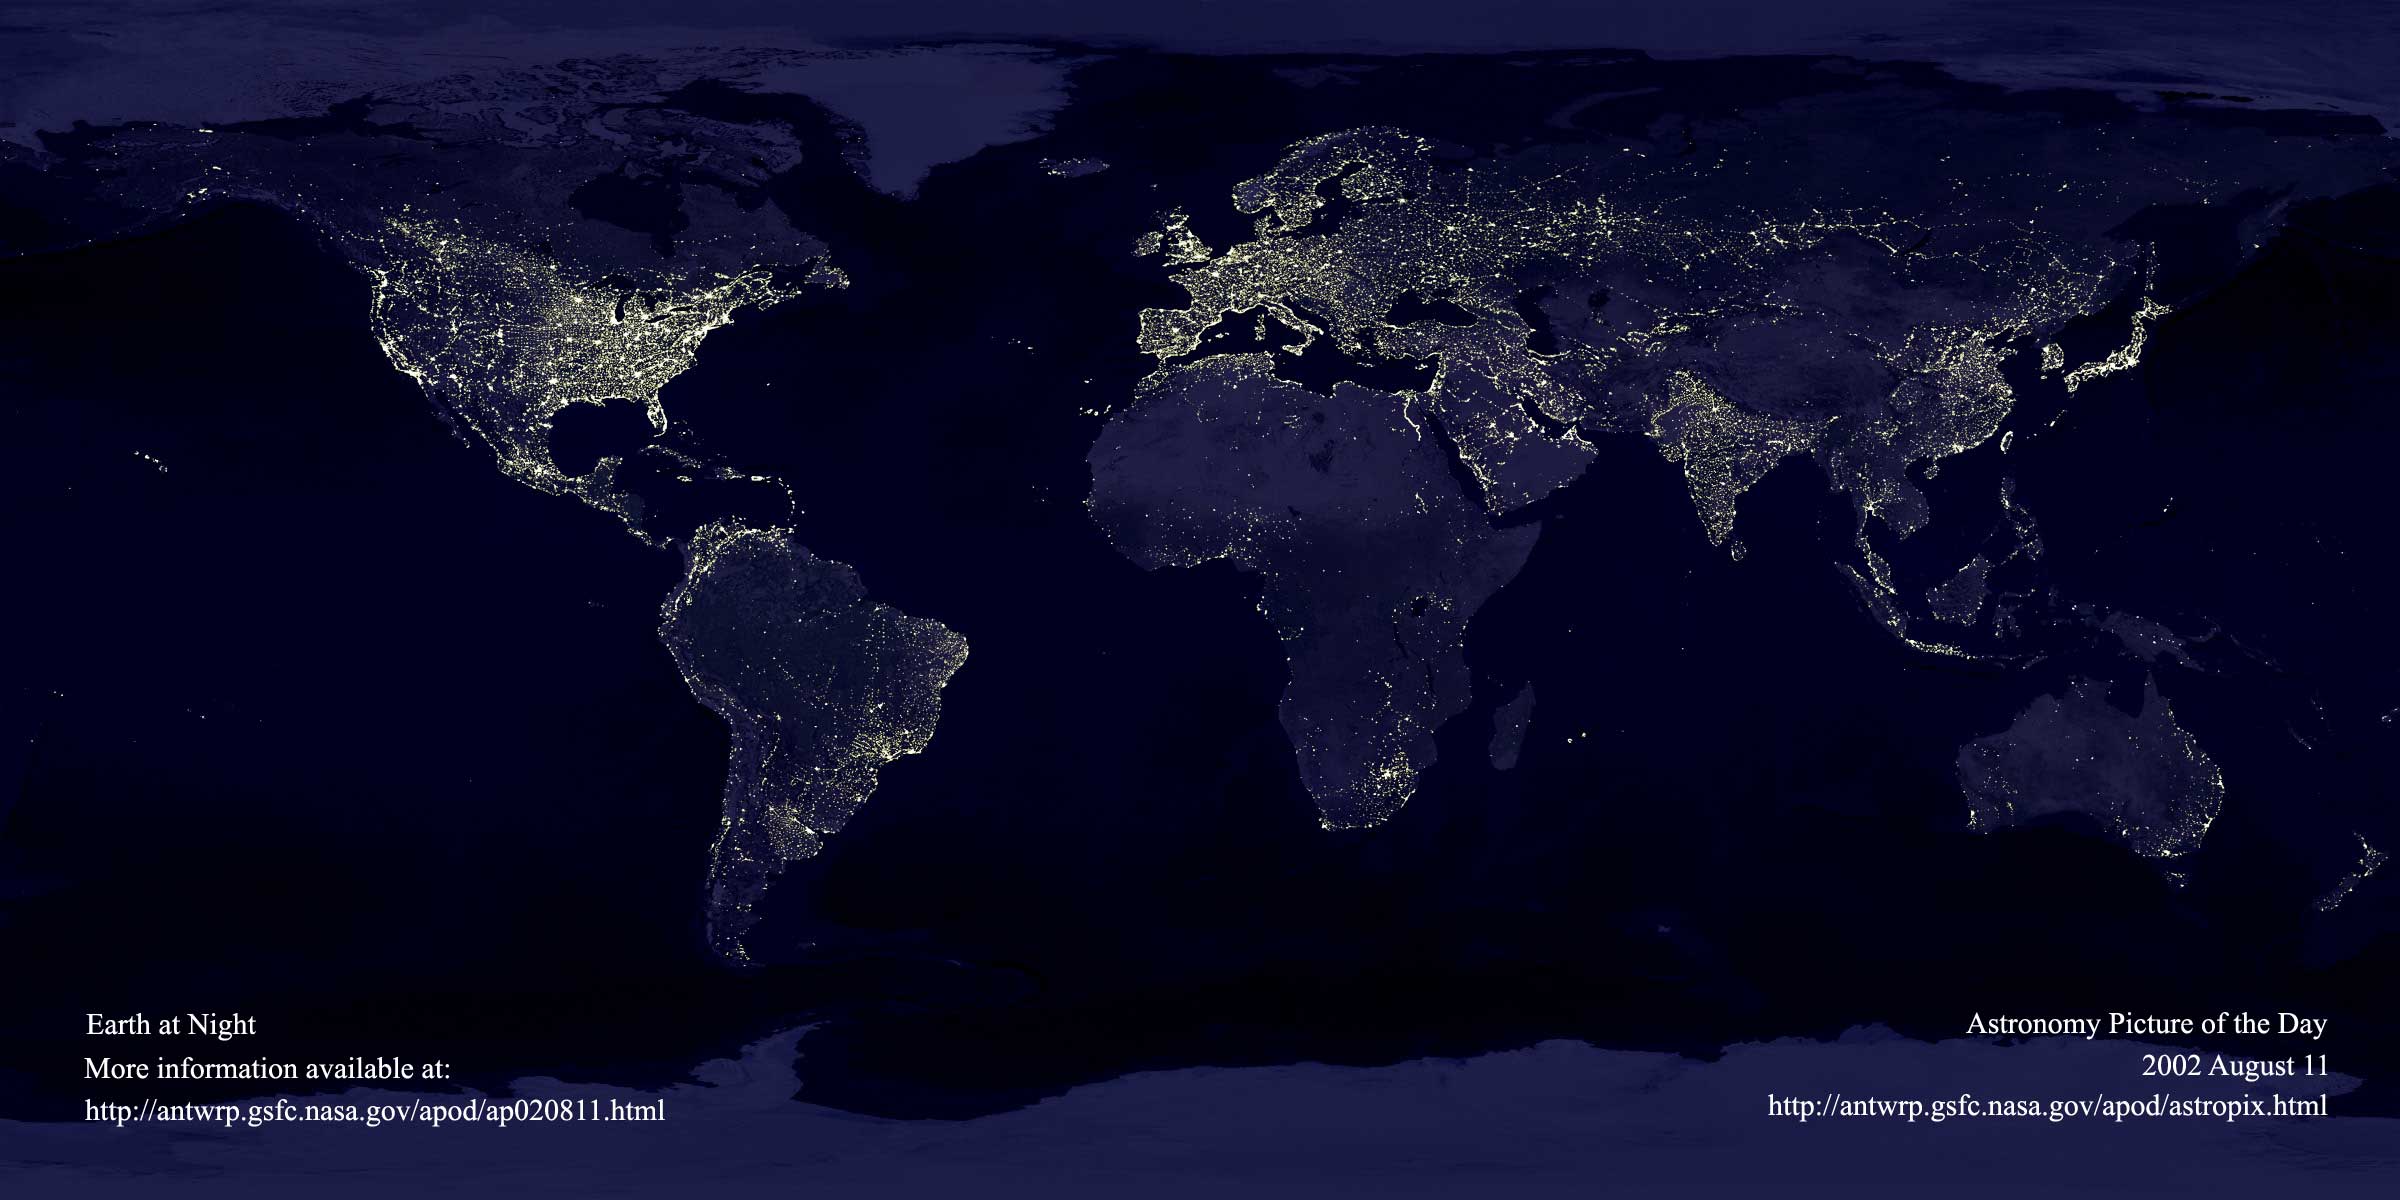
But heavy duty data analysis and statistical processing aside, a little common sense and a couple of pertinent images should put this idea to bed. Here is an image, taken from Astronomy Picture of the Day (a wonderful site, by the way), of the surface of the earth. It is a composite of hundreds of satellite images all taken at night. (The large version is well worth the download time!)


Aside from being very beautiful, it is a perfect indicator of urbanization on earth. As you can see, the greatest urbanization is over the continental United States, Europe, India, Japan, Eastern China, and generally coastal South America.

This next image was taken from NASA GISS. It is a global surface temperature anomaly map which shows warming (and infrequently, cooling) by region.


Look at North America, look at Europe, at Asia, Australia, Africa and the Poles and compare them to the urbanization in the image from APOD. There is quite simply no way to discern any correlation whatsoever between urbanization and warming. If the UHI effect were the cause of warming in the globally averaged record, we would see it in this map.

The claim that global warming is an artifact of the Urban Heat Island Effect is simply an artifact of the Urban Myth Effect.

Addendum: Wikipedia has a very good article on this subject. Among all the interesting details it mentions a few papers that directly discuss efforts to identify and quantify UHI influences on the global temperature trend including this one (PDF), which would be a good one to cite:
A 2003 paper ("Assessment of urban versus rural in situ surface temperatures in the contiguous United States: No difference found"; J climate; Peterson; 2003) indicates that the effects of the urban heat island may have been overstated, finding that "Contrary to generally accepted wisdom, no statistically significant impact of urbanization could be found in annual temperatures." This was done by using satellite-based night-light detection of urban areas, and more thorough homogenisation of the time series (with corrections, for example, for the tendency of surrounding rural stations to be slightly higher, and thus cooler, than urban areas). As the paper says, if its conclusion is accepted, then it is necessary to "unravel the mystery of how a global temperature time series created partly from urban in situ stations could show no contamination from urban warming." The main conclusion is that micro- and local-scale impacts dominate the meso-scale impact of the urban heat island: many sections of towns may be warmer than rural sites, but meteorological observations are likely to be made in park "cool islands."

If necessary, be sure to refer to all the other ways we know the global warming trend is not an artifact of anything. It is real.


Switch Code: SW-7377-9189-3397 -- Nintendo Network ID: theRepublic -- Steam ID: theRepublic

Now Playing
Switch - Super Mario Maker 2 (2019)
3DS - Phoenix Wright: Ace Attorney (Trilogy) (2005/2014)
Mobile - Yugioh Duel Links (2017)
Mobile - Super Mario Run (2017)
PC - Borderlands 2 (2012)
PC - Deep Rock Galactic (2020)

Is this thread full of sceptics arguing with each other? Just agree that your both wrong and leave it at that.


“When we make some new announcement and if there is no positive initial reaction from the market, I try to think of it as a good sign because that can be interpreted as people reacting to something groundbreaking. ...if the employees were always minding themselves to do whatever the market is requiring at any moment, and if they were always focusing on something we can sell right now for the short term, it would be very limiting. We are trying to think outside the box.” - Satoru Iwata - This is why corporate multinationals will never truly understand, or risk doing, what Nintendo does.

When the whole paranoia of it all hit, I believed in global warming, but I think it's bullshit now. This has all happened many times before, it's nothing new. I just wonder how bad it will get.


And that's the only thing I need is *this*. I don't need this or this. Just this PS4... And this gaming PC. - The PS4 and the Gaming PC and that's all I need... And this Xbox 360. - The PS4, the Gaming PC, and the Xbox 360, and that's all I need... And these PS3's. - The PS4, and these PS3's, and the Gaming PC, and the Xbox 360... And this Nintendo DS. - The PS4, this Xbox 360, and the Gaming PC, and the PS3's, and that's all *I* need. And that's *all* I need too. I don't need one other thing, not one... I need this. - The Gaming PC and PS4, and Xbox 360, and thePS3's . Well what are you looking at? What do you think I'm some kind of a jerk or something! - And this. That's all I need.

Obligatory dick measuring Gaming Laptop Specs: Sager NP8270-GTX: 17.3" FULL HD (1920X1080) LED Matte LC, nVIDIA GeForce GTX 780M, Intel Core i7-4700MQ, 16GB (2x8GB) DDR3, 750GB SATA II 3GB/s 7,200 RPM Hard Drive

Strategyking92 said:
When the whole paranoia of it all hit, I believed in global warming, but I think it's bullshit now. This has all happened many times before, it's nothing new. I just wonder how bad it will get.


A prime example of what a lot of people are feeling, during that first few years where Climate change was most in the public eye everyone for some strange reason thought that the effects would be felt in a few years which is completely untrue. Not enough facts about climate change were given to the public in an easy to understand format, the focus was on how to lower emissions etc so the general population is uneducated about the matter.


Thatmax said:
Strategyking92 said:
When the whole paranoia of it all hit, I believed in global warming, but I think it's bullshit now. This has all happened many times before, it's nothing new. I just wonder how bad it will get.


A prime example of what a lot of people are feeling, during that first few years where Climate change was most in the public eye everyone for some strange reason thought that the effects would be felt in a few years which is completely untrue. Not enough facts about climate change were given to the public in an easy to understand format, the focus was on how to lower emissions etc so the general population is uneducated about the matter.


Whoa, I'm not saying climate change is bullshit, I'm saying global warming is. You know, Crazy Als' theory.


And that's the only thing I need is *this*. I don't need this or this. Just this PS4... And this gaming PC. - The PS4 and the Gaming PC and that's all I need... And this Xbox 360. - The PS4, the Gaming PC, and the Xbox 360, and that's all I need... And these PS3's. - The PS4, and these PS3's, and the Gaming PC, and the Xbox 360... And this Nintendo DS. - The PS4, this Xbox 360, and the Gaming PC, and the PS3's, and that's all *I* need. And that's *all* I need too. I don't need one other thing, not one... I need this. - The Gaming PC and PS4, and Xbox 360, and thePS3's . Well what are you looking at? What do you think I'm some kind of a jerk or something! - And this. That's all I need.

Obligatory dick measuring Gaming Laptop Specs: Sager NP8270-GTX: 17.3" FULL HD (1920X1080) LED Matte LC, nVIDIA GeForce GTX 780M, Intel Core i7-4700MQ, 16GB (2x8GB) DDR3, 750GB SATA II 3GB/s 7,200 RPM Hard Drive