ihatejunkmail0 said:
I've noticed in the news a bunch of stories reporting the sales figures for July. For example: http://www.gamespot.com/news/6177523.html http://www.tgdaily.com/content/view/33537/98/ They all state that the PS3 sold 159,000 units during the month of July. However when I look at VGChartz.com weekly numbers here: http://vgchartz.com/weekly.php?date=39271 PS3 sales, week ending July 8: 60,437 http://vgchartz.com/weekly.php?date=39278 PS3 sales, week ending July 15: 90,820 http://vgchartz.com/weekly.php?date=39285 PS3 sales, week ending July 22: 86,027 http://vgchartz.com/weekly.php?date=39292 PS3 sales, week ending July 31: 106,760 This would indicate that he total July sales is more like 344,044 units. (And that is not including July 1st) So what is going on? Which numbers am I reading wrong? Are the VGCharts weekly numbers shipped units? I know they are based on projections from retailers, so there can be some error. But to be off by over a factor of 2 is rather disconcerting. I'm if I'm not reading the numbers wrong, does this mean that VGCharts weekly numbers are totally unreliable? And if so, why even bother posting them? |
You don't know about what you speak.
First, you see at vgchartz the world numbers instead of seeing the NA numbers, which are not only US numbers (they include Canada and Mexico and South america, so must be higher as US numbers).
Second, the US numbers of npd you speak, concern this period: 8 july/ 4 august, so you speak about bad weeks. The good weeks are those ending 14, 21, 28 july and 4 august
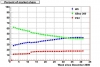
Third, you don't have seen these news:
http://www.vgchartz.com/news/news.php?id=510
which must be the first action you must do before posting what you have posting.
(comparison between npd numbers and vgchartz numbers)
Fourth, you ignore that:
http://www.vgchartz.com/welcome.php
which learn you:
VG Chartz verifies the accuracy of sell-through data by comparing with manufacturer production and shipment data and also by comparing with competing sell-through services, if available. By constantly adjusting sell-through data and adopting a multifaceted approach, we can present information that is as unbiased, accurate and as complete as possible.
which say you that the NA numbers for July (the 4 week i speak before) will be adjusted the next week, for beeing better.
So, before posting for your first post, you must see the website better, don't imagine that one body (ioi), can be a magician against a big organisation which has a lot of money to do this job.
I hope to help you to better understand, and the other new Vgchartz user, which don't understand good, how vgchartz do for his website.
Thanks for reading that. You are not the first.