By using this site, you agree to our Privacy Policy and our Terms of Use. Close

Forums - Website Topics - What analyses / comparisons would you like to see?

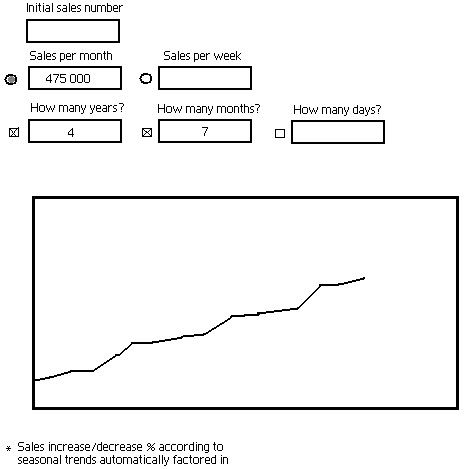
Maybe a variation of charts? Like, line graphs, pie charts, bar graphs, dotted graphs, etc.


Around the Network

The area chart is cool how much coverage do the consoles have in market share should be added to the chartz it seems cool.


mM

What we need first is the missing data under console comparism I think.

Because I´d like to analyse past generations (with market share etc.) but I can´t find enough data for it. Example: vgchartz has the PC Engine at 3 million or so, but Wikipedia has it at 10 million. Same goes for 3DO, Atari consoles and handhelds other than GB and Game Gear - every site shows different numbers which makes it impossible for me to show a realistic piechart.

Also, if I want to analyse 4th (5th, 6th...) generation data, I´d like to show Japan, America und Europe figures in there but I don´t have enough to show how the market developed back then.

But I think past generation analysis would be great.


I would like to be able to choose my own scales in the current graphs.


twould be nice to set date margins on the current graphs, as well as the ability to put more sets of results on at once [say 5 consoles instead of 3]

software charts?... i dont mean the game comparisson ones like for japan, but total software sold charts would be good [no need to go back past this gen though]

i would say earlier historical data for Eu/US but i am quite sure that if its not impossible its incredibly difficult and/or expensive. edit; maybe software could be added to the current charts as a bar chart [like the combo graph above] so for a specific system you could turn software on/off.


Around the Network

A projection tool sounds nice.

You could insert a number for either monthly or weekly sales of a console, then have program automatically increase/decrease the sales by a percentage depending the season trends.

Of course it would be a really rough projection, but a neat little tool none-the-less.

A crude example whipped up in MS Paint:

(Sorry, but you'll have to zoom the image or right click and view it on its own)

Instead of having an "Initial sales number", you could have a drop down menu between the three consoles and use the current numbers for which ever one you chose.

Maybe you could go even further, and have these options for all three consoles on the same page, and put them on a projected chart like the one above... but with coloured lines.


By life end:

  • Wii- 100 million+
  • Xbox360- 35~40 million
  • PS3- 30 million
  • PSP- 30~32 million ------------- FAILURE
  • NDS- 85~90 million (Skeptical)  - FAILURE
  • NDS- 100 million+ (Optimistic) -- Success!


How about one that shows the price of the game at the time of the sales. Like when the price gets dropped it will show the increase. I dunno.


fgsduilfgasuklwgefidslzfgb4yiogwefhawi4fbielat5gy240bh3e

I've sometimes wondered what the situation was at this point last gen, being as I am a lapsed gamer who did not care about sales 5 years ago. I just know that Sony crushed the other two.

So I'd like a button or something on each weekly sales (maybe situated under the charts?) numbers which would send me to the charts of the year before. A pop up with the charts would be enough.


I'd like to see software attach rate charts.


an area graph of monthly or yearly console sales would definitely be interesting. Would be a nice way of showing how the market share increases/decreases wth time


Help! I'm stuck in a forum signature!