darthdevidem01 said:
@mrstickball
you actually understand the weird chart.
seriously I don't get it....why are there so many wird white lines n random shaded colours |
The chart is a year-by-year graph of the revenue brought in by all hardware and software for a particular system...To show how much the video game industry has grown in the past 13+ years.
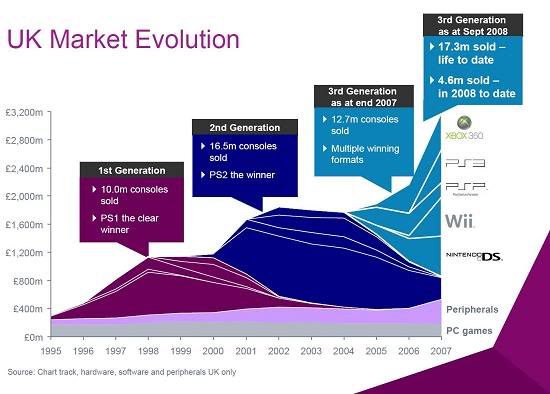
Each generation's revenue is defined by a different color - Purple is the PS1/N64 generation, Blue is the PS2/Xbox generation, and light blue is the Wii/PS3/X360 generation.
The white lines define the total revenue share of a given system's products (games and software) compared to the other titles, and by a larger picture of generations.
So if you look at the PS1 generation, the biggest share is PS1 products, follow by (I assume) N64 stuff. Likewise, each line in the PS2 generation are different products, dominated by the Playstation 2's revenue for games & hardware - Even in 2007, you see a huge bit of the market taken up by Playstation 2 products.
On down the line, you see in 2007 that every system brought in a very similar amount of revenue - Wii, DS, X360, PS3, PS2 and PS3 products all brought in very similar numbers (although the PSP/PS2 share were shrinking). That's very interesting given the fact that the PS3/X360 alone are selling more product than the PS1 generation did at any given time in it's lifespan.
The final amount to be in awe at, is the market jumped from $1,2b pounds in 1998 to just under 3,2b pounds in 2007. Not to mention the fact that there has already been more hardware sold this generation in the UK, than there was in the entirety of the Playstation2/GBA/Xbox/GCN era of gaming.