This is from my article but it fits in well here.
Quarterly Results
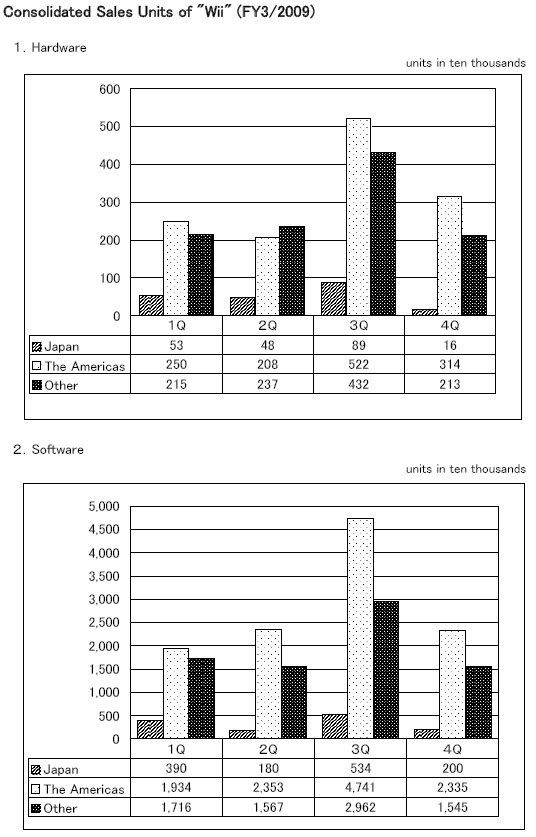
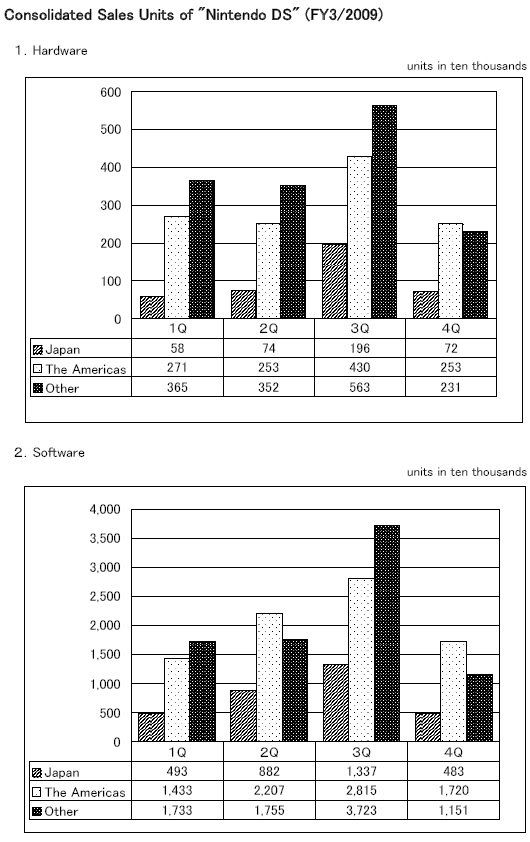
For the March 2009 quarter, Nintendo shipped 11m units of hardware – 5.56m DS, and 5.43m DS. Through March there were 23.54m Wiis shipped in the Americas, 7.96m shipped in Japan, and 18.89m Wiis shipped in Other regions. Those figures indicate that Nintendo shipped 3.14m Wiis to the Americas as only 20.40m Wiis had been shipped to the region through December. Japan by contrast grew from only 7.80m to 7.96m units in the quarter. Other regions were in between, with Wii shipments of 2.13m for the quarter. DS hardware shipments grew to 26.39m in Japan from 25.67m units in the quarter. In the Americas, DS grew to 34.46m from 31.93m. Lastly, for the Other regions, DS grew from 38.62m to 40.93m.
Wii software shipments totaled 40.80m units, bringing Wii software to 353.02m units worldwide through March. Only 1.99m Wii games were shipped in Japan for the quarter, bringing Wii software in Japan to 34.09m. In the Americas, Wii game shipments totaled 23.35m - which is almost as big as the entirety of the Japanese Wii software market – to 193.01m units through March. For Other regions, Nintendo shipped 15.45m games in the quarter, bringing the lifetime total to 125.92m Wii games.
DS software shipments for the quarter totaled 33.54m units, bringing the DS games market to 566.92m lifetime, over 10% larger than the NES or GB markets and still growing. In the quarter, DS game shipments were 4.83m in Japan bringing the DS game market in Japan to 146.95m units through March. For the Americas, DS game shipments were 17.2m units, bringing the DS game total to 204.95m units in the region. In Other regions, DS game shipments were 11.50m units bringing the DS game total to 215.02m units in the region.
Wii and DS software Purchasing Trends
With the data updated for another fiscal year, we can also look at Nintendo’s estimates at how active its hardware base will be over the next year. The most important figure in the chart is SW FY/ HW LTD as it is the number of games bought in a year by the total number of people who own the system at the end point of the year. Rapid increases in hardware sales usually are accompanied by a slow decrease in software interested by the average system owner – this pattern has held true for all systems in the last 15 years at least.
|
DS |
HW FY |
SW FY |
SW FY/HW FY |
SW FY/HW LTD |
LTD SW/LTD HW |
Year Ending |
|
FY1 |
5.27 |
10.49 |
1.99 |
1.9905 |
1.991 |
Mar-05 |
|
FY2 |
11.46 |
49.95 |
4.36 |
2.9857 |
3.613 |
Mar-06 |
|
FY3 |
23.56 |
123.55 |
5.24 |
3.0665 |
4.567 |
Mar-07 |
|
FY4 |
30.31 |
185.62 |
6.12 |
2.6292 |
5.235 |
Mar-08 |
|
FY5 |
31.18 |
197.3 |
6.33 |
1.9385 |
5.570 |
Mar-09 |
|
FY6 |
30.00 |
180 |
6.00 |
1.3659 |
5.821 |
Mar-10 |
The DS software market is Nintendo’s biggest ever. Nonetheless, for the year ending March 2009, on average the DS owner only bought about two games. With the drop in software bought per DS owner only expected to drop to 1.37 from 1.94 it appears Nintendo expects the DSi to slow disinterest in DS software, as the projected drop is more akin to the drop seen in fiscal year March 2008 when the DS Lite began to sell extraordinarily well. If Nintendo beats its DS software projections again, as it did this year the drop may only be to 1.5 or 1.6 games per year. With the DS only just beginning to slow down in hardware shipments, DS software shipments per year can realistically stay above 100m through at least fiscal year 2011, so long as there are over 150m DS systems out through FY 2011, the average DS owner can buy less than one game and Nintendo can still maintain 9 digit software shipments for the system.
The Wii audience buys significantly more software than the DS audience.
|
Wii |
HW FY |
SW FY |
SW FY/HW FY |
SW FY/HW LTD |
LTD SW/LTD HW |
Year Ending |
|
FY1 |
5.84 |
28.84 |
4.94 |
4.9384 |
4.938 |
Mar-07 |
|
FY2 |
18.61 |
119.60 |
6.43 |
4.8916 |
6.071 |
Mar-08 |
|
FY3 |
25.95 |
204.58 |
7.88 |
4.0599 |
7.004 |
Mar-09 |
|
FY4 |
26 |
220 |
8.46 |
2.886 |
7.500 |
Mar-10 |
In fiscal year three, the average Wii owner bought over four games. With over 50m Wiis out there, that meant that Wii software topped the best year for DS software even though DS had a base twice the size of Wii. Nintendo underestimated its Wii software in the previous fiscal year by about 15% in its April 2008 projection. If something similar were to happen this year, Wii software would end up at 250m units for the year which would be ~3.3 games bought by the average Wii owner instead of 2.9. Based on drops in game purchasing on other systems from fiscal year three to four over the last fifteen years, the purchasing rate should only drop 20-25%, regardless of user base growth. A 20-25% drop would in fact be in line with figures which would produce 250m, rather than 220m.
The Best Year Ever for Nintendo
Games on Nintendo platforms shipped over 400m units in the year ending March 2009. That is over a million units of software shipped per day, and easily a record amount of content shipped for a videogame hardware manufacturer’s machines. Before the DS and Wii, only two of Nintendo’s systems, the GB and NES, had even reached lifetime software shipments of over 400m units. Nintendo also shipped over 57m units of hardware for the year.
The best non Nintendo years in the industry are from Sony’s hey-day in the early 2000s. In the year ending March 2005 Sony shipped 262m games across the aging PS1, the near peak PS2, and recently launched PSP. Sony shipped almost 37m units of hardware in the year ending March 2008 across PS2, PSP and PS3. Even with current Nintendo’s success those remain impressive figures
Nonetheless, those years are not even second-place anymore. The five best years for software shipments on a manufacturer’s platforms are now:
|
FY Ending |
SW Shipped |
Platforms |
|
FY 3/2009 |
402.5m |
Nintendo |
|
FY 3/2008 |
318.2m |
Nintendo |
|
FY 3/2005 |
267.7m |
Sony |
|
FY 3/2008 |
267.4m |
Sony |
|
FY 3/2006 |
266.6m |
Sony |
Sony’s fiscal year 2009 software projections were 250m, so if the company beats the figures by more than 16.6m when it releases its figures on May 14 it could sneak into the top five for FY 3/2009. Nonetheless, at the moment the current Nintendo software peak is 50% higher than Sony’s peak year which is the non-Nintendo standard for the industry.
Nintendo is projecting 180m DS games, and 220m Wii games in FY March 2010, so if the company can beat its expectations even by 1% it will set a new record once again, just as it has the previous two years.
The five best years for videogame hardware shipments by a manufacturer are now:
|
FY |
HW |
Platforms |
|
FY 3/2009 |
57.5m |
Nintendo |
|
FY 3/2008 |
50.7m |
Nintendo |
|
FY 3/2008 |
36.7m |
Sony |
|
FY 3/2007 |
34.5m |
Nintendo |
|
FY 3/2009 |
33.0m |
Sony |
The red figures are Sony’s projections for the current fiscal year which have yet to be announced. However, unless Sony dramatically misses its projections, it should be the fifth highest manufacturer fiscal year total for hardware. For the March 2010 year, Nintendo expects to ship 56m more units of hardware. Beating that figure by even 3% would result in another record setting year for Nintendo hardware.
People are difficult to govern because they have too much knowledge.
When there are more laws, there are more criminals.
- Lao Tzu


