By using this site, you agree to our Privacy Policy and our Terms of Use. Close

Forums - Politics Discussion - Is "the rich getting richer" a problem?

That's an extremely deceptive or very stupid way to use the data.

The recession's happened when it was at it's highest NOT because it was at it's highest, but because when wealth is destroyed it usually is disproportionately destroyed at the top.  You've got your causation wrong.  It's not the highness that causes the crash.   It's that the crash causes the number to shrink aftewords!


Additionally, you're using decades long data and ignore the more local trends.

Instead I would suggest looking within decades which is a much better way to look at the data as it cuts back on extranious values. (Like say, huge industrial revolution, being the sole economic super power.....)


Around the Network

Or to do the work for you.

I'd say the first Tax change without a huge outlier... like say WAR would be 1954. (War being an outlier because government spending artificially inflates GDP.)
`
Tax rate decreased by one... had a one year boost, then a drop, then a boost again... kinda inconclusive but it was a tax cut of 1% on a tax rate of 92%.

So when was the next tax raise/cut....

`1964... BIG tax cut. If we look at 1964 on your chart, we can note that the wealth creation was leveling off... then takes a big boost after 1964 for a couple of years.

We continue to have growth until 1968 or 1969 when we see a loss in wealth. Those are years in which the tax rate was increased.

1970 sees the start of big rise. 1970 see's the tax rate drop back down to where it was before 1968.

Taxes stay consistent until 1983. (They lower in 1982 but by less then 1%.) In 1983, either there is a huge boost, or a very slight drop followed by a huge boost.) This was during a huge tax cut.

1987 Tax drop.... in the middle of a big rise. The rise appears to get slightly steeper.

1988 tax decrease Growth seems to level off a bit, finally some support for your suggestion.

1990 tax increase... wealth creation drops. So much for that.

1993 tax increase. There is a big boost tied to a tax increase.

2001 tax cut. Tax increase, in the middle of a boost. Boost seems to get steeper.

2005. Tax cut, wealth goes down... in the middle of the biggest financial crisis since the great depression. (would call that an outlier.


Of the times I can see that would be valid (no factors too huge)... it would seem that it would be 7 to 2 as far as Tax cuts vs Tax Raises on the rich goes.


Oh and when it comes to Life expectancy and Infant Mortality there are a couple things to note.

First countries Judge Infant Mortality different... and the US is one of the most "rightwing" in doing such.

Countries set different qualifiers on what counts as "Infant Mortality". If you give birth in France for example, if the baby isn't a certain length, and he dies it isn't counted towards infant mortality even though he was born alive.

Basically every country has exceptions like that... using length or weight because they want to judge how many babies live that should have lived.


The US doesn't have any such requirement. Any baby that takes a breath is counted under infant mortality, instead just being a count of how many live babies die. Adjusted for other countries factors, the US Infant mortality rate is at the same level as other developed countries.


Not sure how that effects the US, or stress, or for that matter our huge incarceration rate, culture in general etc..

It's worth noting that given equal healthcare services outcomes vary WIDELY. Due to a number of factors unrelated to health, and sometimes even the economy.

Although the field of economics and helping the poor get healthy food is showing to possibly be helpful... for there eventual children. As it seems there is a form of "Genetic Memory" that actually exists! Where fat people's kids are more likely to be fat... not by hardwritten genes, but by something in the way they ate carrying over through genetics....

I forget exactly how... too lazy to look up the research paper right now.


Although, actually recent healthcare research suggests that wealth doesn't actually effect obesity.  Or rather, not in the way we expect.  Being poor doesn't make you fat... but it will make you MORE fat.


The Poor aren't disproportionatly obese, but they are disproporrtionatly morbidly obese.

It's hard to figure out what the right fix is to motivate more people to eat healthy.


Kasz216 said:

That's an extremely deceptive or very stupid way to use the data.

The recession's happened when it was at it's highest NOT because it was at it's highest, but because when wealth is destroyed it usually is disproportionately destroyed at the top.  You've got your causation wrong.  It's not the highness that causes the crash.   It's that the crash causes the number to shrink aftewords!


Additionally, you're using decades long data and ignore the more local trends.

Instead I would suggest looking within decades which is a much better way to look at the data as it cuts back on extranious values. (Like say, huge industrial revolution, being the sole economic super power.....)

You're viewing the wrong part of it. That it went downwards after the recession/depression hit isn't the important part. The important part is where it was climbing rapidly prior to it. If you look at the minor recessions, you'll see that they typically occurred when there was no rapid climbing prior to it. It was the big ones that involved dramatic peaks.

And looking "within decades" doesn't make sense, because the rules don't typically change much within a decade, except for the big changes that occur on the broader view.

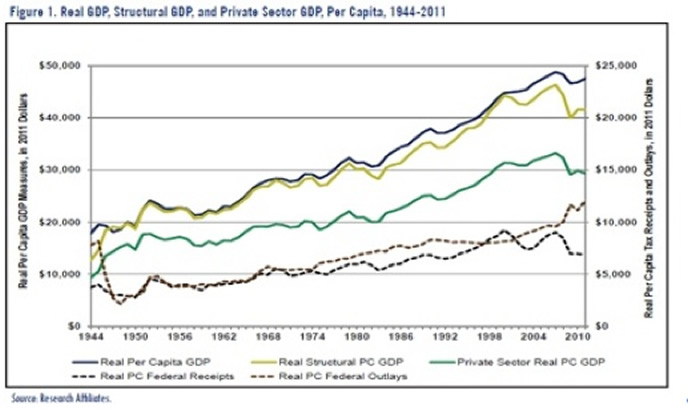
But if you insist, let's look at what happened in the 2000s. Tax cuts for the rich (and yes, everyone else) weakened the economy. Mind you, they caused short term boosts, without a doubt. But the end result was a weakening. Look just at the 2000s in the per capita GDP graph. Specifically, look at the downturn that happened. You can't blame it on the housing bubble, or anything like that, because the downturn started earlier than the GFC and related issues.

Meanwhile, which graph are YOU looking at? I look at the GDP per capita graph, and see an acceleration beginning in the early 1960s (when the tax rate was very high) and then only a momentary variation in 1968 and 1969, likely the driving force for the tax rate changes. More importantly, I look at what happened starting in 2001 - and what I see is an exponential growth pattern up to 2000, and then a sudden flattening in 2001, followed by a slower growth pattern that accelerated until around 2005, at which point it downturned, and by 2007 it had a negative slope. How the hell can you interpret that as supporting the idea that tax cuts drive GDP higher? And no, 2005 was not the start of a financial crisis. That was 2007, when the housing bubble peaked. The economy was already downturning by then.

Let's make this easier using a graph showing CHANGE in GDP per capita by year.

So, let's look at these relative to tax rate. Starting with 1950, there's four solid years of growth of over 2%. So what happened in 1950? Tax increase.

What happened in 1954, though? Tax decreased a bit. Presumably, not a significant effect, though, so let's move on, and ignore it. The next significant event in terms of tax was in 1964-1966 - no significant effect for those three years on GDP. Then in 1967 GDP growth dropped. In 1968-1969, taxes were increased, and GDP returned to stronger growth. Then in 1970, taxes were cut again, and GDP change went negative again.

Taxes stabilised after that, so we now jump forward to 1982, when there was a significant cut in tax. In 1982, GDP change was more negative than any time since 1947. Then the next tax cut came in 1987 - year of the lowest GDP growth between 1983 and 1989, although admittedly only a small drop. In 1991, there was a tax increase that did tie with a GDP drop - the first one we've seen so far. In 1993, tax was increased again, more significantly, and didn't make much difference.

Finally, the tax was reduced in 2001, 2002, and 2003. In 2001, GDP growth dropped to nearly zero, and despite two more cuts, growth remained slower than prior to 2001.

So to tally the results, we find that drops on tax increases = 1. Drops on tax cuts = 3. Now, using the total GDP per capita graph, we look at average growth rate during the period in which the top tax rate was greater than 65% - that is, 1936 to 1981. GDP per capita in 1936 was roughly $9000. In 1981, it was about $29,500. That's an average growth rate of $456 per annum. Between 1982 and 2010, the tax rate was never above about 50%. In 1982 it was about $28,500 (rounding down) and in 2010 it was about $48,000 (rounding up). Average growth rate was $696 per annum. Which makes the latter case sound better, until you remember that this isn't scaled to current GDP - that is, we're looking at the absolute number, rather than the percentage increase.

So let's look at the percentage increase. We'll look at it three ways - relative to starting GDP, relative to average GDP, and relative to finishing GDP. So, the three percentages (per annum) for the high-tax period were 5.067%, 2.369%, and 1.546%. For the low-tax period, they were 2.442%, 1.82%, and 1.45%. So no matter which scaling you choose, the high-tax period came out ahead.

A better demonstration would be made by doing a 5-year running average, to smooth out short-term fluctuations, and view the net effect.

Evidence is rather strong - economy may take a small hit on tax increases in the short term, but it improves the economy in the longer term. Tax cuts, on the other hand, often causes a stronger hit to the economy in the short term, and less impact in the longer term.

But remember, we're looking at all of this in isolation. If one were to look deeper, you'd find that it's not the tax cuts or increases that are affecting the economic conditions. It's actually government activity. When government cuts spending (which is necessary when cutting taxes), it weakens the economy. Increased government taxation allows better spending, which drives the economy.

It should be noted, though, that the current tax systems in both Australia and America have a major flaw - it actually encourages the rich to get richer and to not invest in reasonable ways. And this was still true when taxes were absurdly high for non-extreme cases. My idea is to have taxes simplified in terms of numbers (simple steps of 10%, starting at 0% and finishing at 90%), but having the point at which each tax rate kicks in be varied automatically based on the distribution of income. And then, investment would simply subtract from the taxable income, but divestment would then add back to the income in the year that it happens.

For instance, a simple example that I've come up with works off a simple 50% basis, and it works like this: consider the total income of the entire population; let's say that it's $1 trillion, as an example number. Then you find the income value, X1, such that, if you add all of the incomes of people who earn less than X1, and then X1 of the incomes for the rest of the population (so if X1 = $10,000, and you earn $5000, then it adds your whole $5000, but if you earn $15,000, then it adds just $10,000), the total is $500 billion. That is, 50% of the total income. Those who earn X1 or less pay 0% tax, and those who earn more than X1 pay no tax on the first X1 of their income.

Then, 10% tax is charged on incomes between X1 and X2, where X2 has a similar property - add up all incomes up to X2, and it should work out to 75% of the total income, or $750 billion (so 25% is between X1 and X2). It works the same way for X3, X4,... X9, each time adding 50% of what remains. All incomes above X9 are taxed at 90%. I would also considering having it work on household rather than individual incomes, with certain conditions (such as each household representing some number of people - for instance, maybe additional adults are valued at 0.5 and children are valued at 0.3, so that a household with two adults and two children would be taxed as 2.1 people - those numbers are just examples, of course)

With this system (assuming no economic growth or shrinkage), it works out that the government would end up with about 10% of the total national income. If it worked off 33.333% rather than 50%, then it would end up with about 18.3% of the total national income, whereas if it worked off 60%, it would end up with about 6.68% of the total national income.

The cutoff points would, for the sake of keeping things from being difficult to manage, be set to the values from the previous year. What this means is that, if the economy grows, government gets more total in tax, but if it shrinks, the government gets less. If the economy remains steady, then it doesn't matter what the income distribution itself is, the government ends up with exactly the same amount of tax income. Note that I would duplicate this system for corporate taxes (although the scales may not be identical) - this would actually have the effect of discouraging the formation of huge megacorporations, as such megacorporations would be taxed much harder than smaller companies. Also note that the tax system would be local-based - that is, in order to do business in the country, you would have to have an in-country company branch, which would be taxed based on national income and national expenditure, and thus offshoring would actually harm the company in terms of tax (due to increasing national income but decreasing national expenditure).

What such a tax system would do is it would encourage greater investment by the rich, while giving the government stronger encouragement to grow the economy. It would also encourage companies to pay more to employees, and to do so in a more equal manner. I should also note that I'd abolish most of the other existing taxes (including "Social Security tax" in the US, for instance), and tax "credits" would be very stringently set up, purely as support where absolutely necessary. Note, though, that in the US, this system would reduce taxes on the poor to 0% immediately. Most notably, I'd abolish sales taxes entirely, except perhaps a "luxury tax", but that would be very limited if used at all. Income and Corporate taxes would have a similar effect, anyway.

I know it's a bit hard to follow all of that - it's hard to explain without detailed images that I can't be bothered creating. Think of it as being like a tax system that uses a "water level" effect - up to each water level, you pay a certain amount of tax, and the water levels are defined by national income.

Right now, on the other hand, governments can screw with the numbers without most of the population noticing. For instance, they can increase taxes on nearly everyone without changing the percentages even slightly. All it takes is changing the thresholds - in 2012, for singles, you pay 10% on the first $8700. If you change that $8700 to $7700, then everyone earning more than $8700 ends up paying an extra $50 in tax (and between $7700 and $8700, they pay somewhere between $0 and $50 extra, depending on the exact amount), despite the tax rates themselves not changing.

I'm aware that it sounds complicated... but it's actually no more complicated for the regular person than the current system - indeed, it's simpler for most people, since those not earning massive amounts would just need to look at a table and compare with their income. The table would say, for instance, "Those over X2 but below X3 pay Y2 + 20% tax on all income over X2", where X2, X3, and Y2 would be specific values. It's exactly how the current system works, with regards to income tax tables.

... OK, that's more than enough for now, I guess. Sorry if I bored anyone.


You were right in that I misread the chart.

However, you're wrong when you say government spending drives growth.  Government spending drives GDP, because it's part of the equation.

It doesn't create growth in most cases though because the government mostly takes on ventures that are unprofitable.


As you can see... Government spending.... doesn't really match up with GDP growth.

Taxes receipts do... but they stay pretty consistant with GDP growth no matter what the tax rate actually is!  I forget the name of it.  Laffer Curve maybe?


As for those "Big increases before the crash."

That was because of bubbles...  which are what causes the crashes.

Depression's are like manic depressives.

There is a Boom before a Bust.


Around the Network
Kasz216 said:

You were right in that I misread the chart.

However, you're wrong when you say government spending drives growth.  Government spending drives GDP, because it's part of the equation.

It doesn't create growth in most cases though because the government mostly takes on ventures that are unprofitable.

As you can see... Government spending.... doesn't really match up with GDP growth.

Taxes receipts do... but they stay pretty consistant with GDP growth no matter what the tax rate actually is!  I forget the name of it.  Laffer Curve maybe?


As for those "Big increases before the crash."
That was because of bubbles...  which are what causes the crashes.

Depression's are like manic depressives.

There is a Boom before a Bust.


It is the job to do unprofitable things that need to be done, because no one else can afford to do them.  There is a debate over what these things are though.

The Laffer Curve has to do with there being an optimal tax rate which assures the maximum amount of tax dollars.  Problem is that the economy is too complicated to find it.  And, if there was an actual number, apparently politicians have little interest in finding it, because out of the GOP side, all they keep talking about is cutting taxes.  Democrats will keep raising taxes.  Neither one focuses on optimal, because no one can tell what it is. 

This issue has a lot of gotchas in it, and really hard to nail down anything.  It is ripe for ideologs to keep pushing an agenda mindlessly and get people to feel they are victims, even if they are doing really well personally.  

In regards to government spending, it depends on WHAT it spends it on.  If it spends it on building meaningful infrastructure, research, training and education, and so on, those can lead to an increase in GDP.  If it leds to stimulus, generating temporary and meaningless activity, then it doesn't improve GDP.  Government spending, like spending by any agent in an economy can have good or bad effects.  Spending doesn't magically become good or evil just because the government does it.  Like, whether individuals or the government gives assistance to the poor, the poor is getting assistance.  In some cases, the government may do a better job than an individual, because an individual may end up getting duped by a scammer, while the government has people who are trained and/or have experience dealing with scammers.  Also, collecting and distributing sufficient money via a government program, could lead to more stable funding, and a better way to tackle an issue an area.  Again, it is what is done that matters far more in an economy, than who does it.  Now, if anyone wants to debate whether or not the use of coersion by government to do anything is ethical or not, that is another issue, but separate from the impact on the economy.


Kasz216 said:

You were right in that I misread the chart.

However, you're wrong when you say government spending drives growth.  Government spending drives GDP, because it's part of the equation.

It doesn't create growth in most cases though because the government mostly takes on ventures that are unprofitable.


As you can see... Government spending.... doesn't really match up with GDP growth.

Taxes receipts do... but they stay pretty consistant with GDP growth no matter what the tax rate actually is!  I forget the name of it.  Laffer Curve maybe?


As for those "Big increases before the crash."

That was because of bubbles...  which are what causes the crashes.

Depression's are like manic depressives.

There is a Boom before a Bust.

You're right that governments spend on things that are unprofitable for corporations. But you see, it's unprofitable for corporations because corporations only make money through selling things or investing in things. Governments, on the other hand, spend money on things that benefit the entire economy.

Consider highway creation. It costs a huge amount of money, and unless there's tolls on the highway, it is not at all profitable for the company that actually created the highway. Therefore, if left to corporations, highways don't get built. But the government works differently. The government pays for the highway. There are two impacts that this has - one is employment, and the other is resulting infrastructure.

In terms of employment, the money spent on the highway goes to three things - the company actually laying the road, the companies who provide the materials used, and the people who actually plan the highway. Let's focus on the company laying the road. They suddenly have significantly more work than they otherwise would have had. This means that they can employ more people, and those who work part time also get more work. Those employees get income, which they then pay tax on. But that's not the end of it. Being relatively low-paid workers, most of the money they make will be spent on things (that is, not a huge amount will be "saved") - that money then increases the revenue, and thus the profits, of other companies, which then gets taxed, and much of the money goes to employees again, which gets taxed again, and those employees spend the money on things, which goes to yet other companies, and so the cycle goes.

Another effect is that the employees can now afford health insurance, and thus are no longer a drain on the health system, which saves the government money in this respect (it's a common misconception that America doesn't have socialised medicine - indeed, Obamacare seeks to end socialised medicine, not establish it). That they can afford more and better quality food means that they, and their families, are also less likely to end up in hospital, thus further decreasing the strain on the system, and saving the government more money. It also gets them off social security, which saves the government even more money.

The company providing the materials undertakes the same effects - their employees make more money, more people are employed, and again, more tax and less expenditure for the government. Same again for the people doing the planning.

And yet, that's only half of the effect of the highway. The other half is the direct impact on other companies. Providing more efficient shipping and transit to companies reduces fuel costs and delays in shipping, decreases employee frustration (caused by being stuck in traffic), and makes it easier for customers to reach shops, etc. This all helps to improve the economy, which results in more profits for companies, which boosts tax income.

This is how stimulus works, too, but in a much broader sense. We mentioned roads. The same sort of thing works for a wide variety of expenditures. Different expenditures have a different impact. For instance, the bank bailout will have had little positive benefit on the economy or on government debt. However, had the government instead bailed out people who were stuck in bad debt (that is, the individuals risking foreclosure), it would have had a much stronger effect on the economy, as such individuals would have paid off their debts, and found themselves in a much stronger financial position, thus being able to spend money on other things. By bailing the banks out, money was only inserted into the financial sector, which acts much more like a black hole with regards to economic stimulus.

Regarding the "Laffer Curve", what it actually shows is that there's an optimal tax rate, not that the revenue remains roughly the same. This is obvious, because at 0% tax, tax revenue must be zero, and at 100% tax, tax revenue will be zero due to no reason to make money, but in between, it must be non-zero. Of course, in reality, things are much more complex than the Laffer Curve suggests. Here's a realistic plot of the Laffer Curve in 2004:

In reality, the Laffer Curve's biggest weakness is the inability to handle progressive tax systems - that is, tax systems where the tax rate increases as you make more money.

You mention boom and bust explaining the peaks, by the way... but this makes no sense, since the graph is representing the rich's proportion of income, and not the size of the economy. Indeed, the plot of GDP per capita shows that the boom periods were not particularly fast-growing in terms of the overall economy. What the boom periods show is rising inequality - the rich getting richer at the expense of everyone else. And when this happens, and the economy goes bad as a result, the rich start losing their lead... but it hurts everyone.

But let's focus on the real key - during the period where the top tax rate was 65%+, GDP growth wasn't any slower, on average, than in any other period... and yet, income inequality decreased substantially, with the upper 1% earning only 8-9% of the income, compared with more like over 17% currently. Similarly, the top 0.1% and 0.01% were earning significantly less of the proportion than they are now. The last time that the inequality was this high was in the era of the great depression. We could continue focusing on the effect of tax cuts or tax increases on the economy, but as we've both noted, the effects are mostly short-term only, with little long-term direct effect. But when one looks at the effect on income inequality, one sees a very different story - income inequality increases when the top tax rate is lower, and evidence shows that high income inequality eventually becomes very bad for the economy.


Actually, that's exactly what the Laffer Curve measures.... progressive taxation. Corporate taxation isn't really a good thing to measure vs countries because deductions vary a lot and don't really measure individual taxation. (IE more businesses there = more personal receipts.)


Which is kind of the point. Like I said, look at the graph. The level of government spending doesn't really correlate with profits at all.

Things like highways are the exceptions... and very rare ones at that when it comes to government spending... and ones that get diminishing returns.

For example... look at Highways. They're already built. Most of the spending on new highways don't really bring any results at all, and aren't very useful.


Kasz216 said:
Actually, that's exactly what the Laffer Curve measures.... progressive taxation. Corporate taxation isn't really a good thing to measure vs countries because deductions vary a lot and don't really measure individual taxation. (IE more businesses there = more personal receipts.)


Which is kind of the point. Like I said, look at the graph. The level of government spending doesn't really correlate with profits at all.

Things like highways are the exceptions... and very rare ones at that when it comes to government spending... and ones that get diminishing returns.

For example... look at Highways. They're already built. Most of the spending on new highways don't really bring any results at all, and aren't very useful.

No, the Laffer Curve describes the correlation between a FLAT tax rate and the resulting tax revenue. As a progressive taxation system involves increasing tax rates as personal income increases, one cannot represent a progressive taxation system using a single tax rate number, as the Laffer Curve uses. And the point of the graph I showed was to demonstrate the problem with the Laffer Curve - that it's a very simplistic representation of a highly complex topic.

As for your graph, what I see is the total government spending as a reactionary thing. It doesn't correlate well because governments like the US government are very bad at targetted spending. Instead, they tend to be very politics-based - they pay for things because they look good politically, rather than because they actually do well. But many of the long-lasting spending sources are actually quite good for the economy - health, infrastructure, education, social security, and to a lesser degree military spending all have a strong positive impact on the economy. Research and Environment spending often has a strong impact on future economic situations, but not on current ones, because their effects take longer to be realised.

Regarding highways, you're mistaken. Not only is there highway maintenance (which is an ongoing stimulus process), but a growing population needs more highways to handle the higher traffic. And you should note that I'm using Highways because it's a federal-level responsibility - there's also lesser roads, handled at state or local levels. Of course, there's a limit to how much highway construction and maintenance should be done. Same with any field of expenditure. But the point is that properly-targetted spending is a great way to boost the economy, and this requires proper taxation. Tax cuts just restrict the government's ability to stimulate the economy, history has shown that they have never resulted in significant economic boosts.


Regarding highways, for some reason, Braess's Paradox would seem to fit here:
http://en.wikipedia.org/wiki/Braess's_paradox

Build more roads, and it generates more traffic, which is good for businesses along those roads, but ends up making for more conjestion.