


| Kasz216 said: You were right in that I misread the chart. However, you're wrong when you say government spending drives growth. Government spending drives GDP, because it's part of the equation.
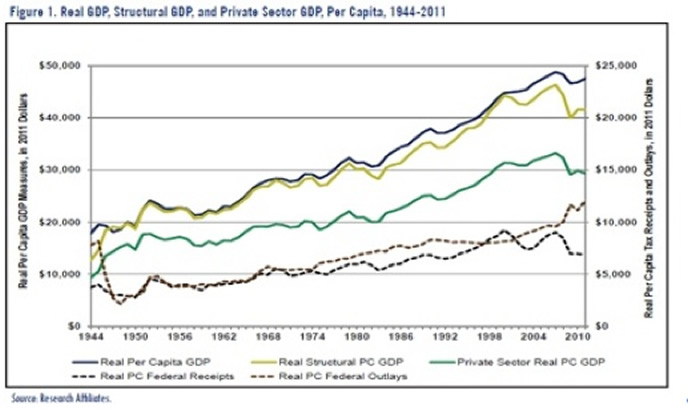
As you can see... Government spending.... doesn't really match up with GDP growth. Taxes receipts do... but they stay pretty consistant with GDP growth no matter what the tax rate actually is! I forget the name of it. Laffer Curve maybe?
As for those "Big increases before the crash." Depression's are like manic depressives. There is a Boom before a Bust. |
You're right that governments spend on things that are unprofitable for corporations. But you see, it's unprofitable for corporations because corporations only make money through selling things or investing in things. Governments, on the other hand, spend money on things that benefit the entire economy.
Consider highway creation. It costs a huge amount of money, and unless there's tolls on the highway, it is not at all profitable for the company that actually created the highway. Therefore, if left to corporations, highways don't get built. But the government works differently. The government pays for the highway. There are two impacts that this has - one is employment, and the other is resulting infrastructure.
In terms of employment, the money spent on the highway goes to three things - the company actually laying the road, the companies who provide the materials used, and the people who actually plan the highway. Let's focus on the company laying the road. They suddenly have significantly more work than they otherwise would have had. This means that they can employ more people, and those who work part time also get more work. Those employees get income, which they then pay tax on. But that's not the end of it. Being relatively low-paid workers, most of the money they make will be spent on things (that is, not a huge amount will be "saved") - that money then increases the revenue, and thus the profits, of other companies, which then gets taxed, and much of the money goes to employees again, which gets taxed again, and those employees spend the money on things, which goes to yet other companies, and so the cycle goes.
Another effect is that the employees can now afford health insurance, and thus are no longer a drain on the health system, which saves the government money in this respect (it's a common misconception that America doesn't have socialised medicine - indeed, Obamacare seeks to end socialised medicine, not establish it). That they can afford more and better quality food means that they, and their families, are also less likely to end up in hospital, thus further decreasing the strain on the system, and saving the government more money. It also gets them off social security, which saves the government even more money.
The company providing the materials undertakes the same effects - their employees make more money, more people are employed, and again, more tax and less expenditure for the government. Same again for the people doing the planning.
And yet, that's only half of the effect of the highway. The other half is the direct impact on other companies. Providing more efficient shipping and transit to companies reduces fuel costs and delays in shipping, decreases employee frustration (caused by being stuck in traffic), and makes it easier for customers to reach shops, etc. This all helps to improve the economy, which results in more profits for companies, which boosts tax income.
This is how stimulus works, too, but in a much broader sense. We mentioned roads. The same sort of thing works for a wide variety of expenditures. Different expenditures have a different impact. For instance, the bank bailout will have had little positive benefit on the economy or on government debt. However, had the government instead bailed out people who were stuck in bad debt (that is, the individuals risking foreclosure), it would have had a much stronger effect on the economy, as such individuals would have paid off their debts, and found themselves in a much stronger financial position, thus being able to spend money on other things. By bailing the banks out, money was only inserted into the financial sector, which acts much more like a black hole with regards to economic stimulus.
Regarding the "Laffer Curve", what it actually shows is that there's an optimal tax rate, not that the revenue remains roughly the same. This is obvious, because at 0% tax, tax revenue must be zero, and at 100% tax, tax revenue will be zero due to no reason to make money, but in between, it must be non-zero. Of course, in reality, things are much more complex than the Laffer Curve suggests. Here's a realistic plot of the Laffer Curve in 2004:

In reality, the Laffer Curve's biggest weakness is the inability to handle progressive tax systems - that is, tax systems where the tax rate increases as you make more money.
You mention boom and bust explaining the peaks, by the way... but this makes no sense, since the graph is representing the rich's proportion of income, and not the size of the economy. Indeed, the plot of GDP per capita shows that the boom periods were not particularly fast-growing in terms of the overall economy. What the boom periods show is rising inequality - the rich getting richer at the expense of everyone else. And when this happens, and the economy goes bad as a result, the rich start losing their lead... but it hurts everyone.
But let's focus on the real key - during the period where the top tax rate was 65%+, GDP growth wasn't any slower, on average, than in any other period... and yet, income inequality decreased substantially, with the upper 1% earning only 8-9% of the income, compared with more like over 17% currently. Similarly, the top 0.1% and 0.01% were earning significantly less of the proportion than they are now. The last time that the inequality was this high was in the era of the great depression. We could continue focusing on the effect of tax cuts or tax increases on the economy, but as we've both noted, the effects are mostly short-term only, with little long-term direct effect. But when one looks at the effect on income inequality, one sees a very different story - income inequality increases when the top tax rate is lower, and evidence shows that high income inequality eventually becomes very bad for the economy.