This is a comparative analysis from the Data I gathered from this site.
The numbers below are entirely in line with my original projections about the US market share, posted here:
http://www.vgchartz.com/article/251427/ps4-vs-xbox-one-us-launch-sales-comparison/
Basically, I am estimating the North American market share between PS4 and XB1 to be...
XB1 : Around 35-45%
PS4 : Around 55-65%
Currently the preorders market share for XB1 is 45% overall, and 42% for third parties, which is more representative in the long run. Those numbers will more likely improve in favor of PS4 in the upcoming months / years due to the network & catapult effects from the rest of the world, in addition to the more price sensitive casual crowd, who will favor PS4, and improved supply constraints.
| 11/22/2013-11/29/2013 | ||||||
| PS4 - Top 10 Launch Sales | Xbox One - Top 10 Launch Sales | |||||
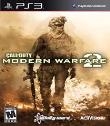
| 1 | Call of Duty: Ghosts | 563,638 | 1 | Call of Duty: Ghosts | 495,223 | |
| 2 | Battlefield 4 | 396,187 | 2 | Battlefield 4 | 252,614 | |
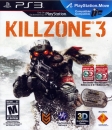
| 3 | Killzone: Shadow Fall | 355,148 | 3 | Assassin's Creed IV: Black Flag | 213,644 | |
| 4 | Assassin's Creed IV: Black Flag | 345,176 | 4 | Forza Motorsport 5 | 225,051 | |
| 5 | Madden NFL 25 | 133,368 | 5 | Dead Rising 3 | 167,766 | |
| 6 | NBA 2K14 | 111,674 | 6 | Ryse: Son of Rome | 143,647 | |
| 7 | Knack | 102,749 | 7 | Madden NFL 25 | 92,424 | |
| 8 | NFS Rivals | 94,157 | 8 | NBA 2K14 | 69,819 | |
| 9 | Fifa Soccer 14 | 77,912 | 9 | NFS Rivals | 62,367 | |
| 10 | LEGO Marvel Super Heroes | 32,188 | 10 | Fifa Soccer 14 | 62,273 | |
| 2,212,197 | 1,784,828 |
| Launch Sales Chart | 11/22/2013-11/29/2013 | |||||
| Titles | PS4 | Xbone | Total | |||
| 1 | Call of Duty: Ghosts | 563,638 | 495,223 | 1,058,861 | 53.2% | 46.8% |
| 2 | Battlefield 4 | 396,187 | 252,614 | 648,801 | 61.1% | 38.9% |
| 3 | Assassin's Creed IV: Black Flag | 345,176 | 213,644 | 558,820 | 61.8% | 38.2% |
| 4 | Killzone: Shadow Fall | 355,148 | 355,148 | 100.0% | 0.0% | |
| 5 | Madden NFL 25 | 133,368 | 92,424 | 225,792 | 59.1% | 40.9% |
| 6 | NBA 2K14 | 111,674 | 69,819 | 181,493 | 61.5% | 38.5% |
| 7 | Forza Motorsport 5 | 225,051 | 225,051 | 0.0% | 100.0% | |
| 8 | Fifa Soccer 14 | 77,912 | 62,273 | 140,185 | 55.6% | 44.4% |
| 9 | Dead Rising 3 | 167,766 | 167,766 | 0.0% | 100.0% | |
| 10 | Ryse: Son of Rome | 143,647 | 143,647 | 0.0% | 100.0% | |
| 11 | Knack | 102,749 | 102,749 | 100.0% | 0.0% | |
| 12 | Need for Speed Rivals | 94,157 | 62,367 | 156,524 | 60.2% | 39.8% |
| 13 | LEGO Marvel Super Heroes | 32,188 | 29,837 | 62,025 | 51.9% | 48.1% |
| All | 2,212,197 | 1,814,665 | 4,026,862 | |||
| 54.9% | 45.1% | |||||
| Third Party | 1,754,300 | 1,278,201 | 3,032,501 | |||
| 57.8% | 42.2% |
Playstation 5 vs XBox Series Market Share Estimates
Regional Analysis (only MS and Sony Consoles)
Europe => XB1 : 23-24 % vs PS4 : 76-77%
N. America => XB1 : 49-52% vs PS4 : 48-51%
Global => XB1 : 32-34% vs PS4 : 66-68%