
jason1637 on 22 January 2021
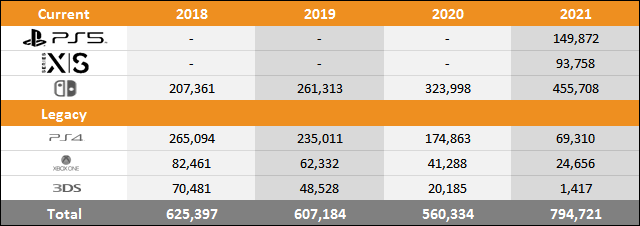
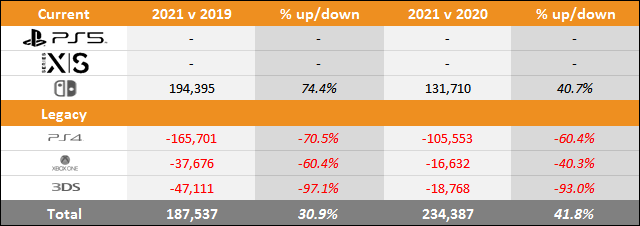
| trunkswd said: Share the article here. PS5 vs Xbox Series X|S vs Switch Sales Comparison Charts Through January 9Year to Date Sales Comparison (Same Periods Covered)
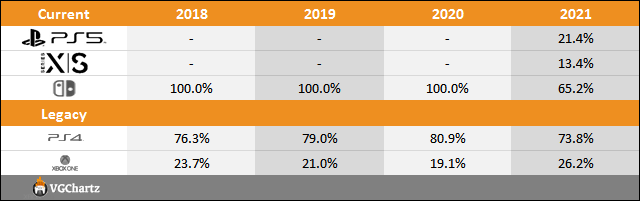
Market Share (Same Periods Covered)
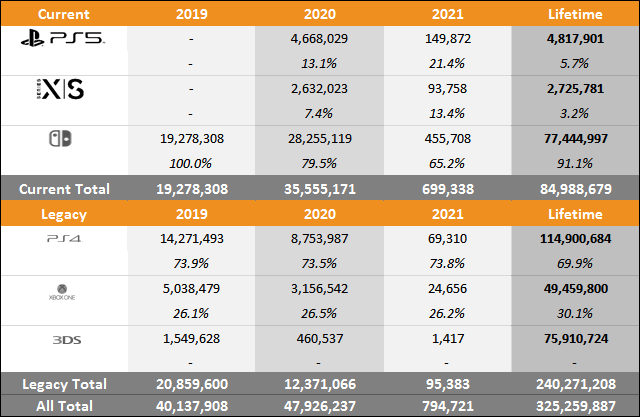
2018 – (Week ending January 13 to January 13) 2019 – (Week ending January 12 to January 12) 2020 – (Week ending January 11 to January 11) 2021 – (Week ending January 9 to January 9) "Year to date" sales for 2018, 2019, 2020, and 2021 sales are shown in series at the top of the table and then just below a comparison of 2021 versus 2020 and 2021 versus 2019 is displayed. This provides an easy-to-view summary of all the data. Total Sales and Market Share for Each Year
Microsoft
Nintendo
Sony
|
Great comparison. I do think adding 2014 for PS4 and XBO would ve beneficial to compare the first full year with the PS5 and XBSX.