| numberwang said:
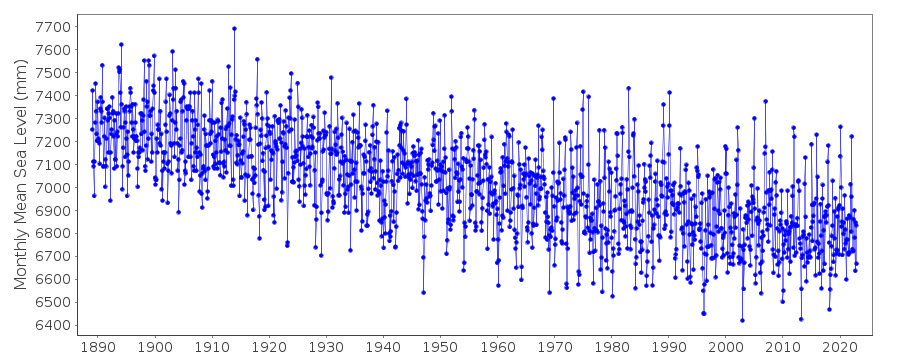
Stockholm water levels for the last 130 years. Home of angry G. Does not look like they are drowning...
|
Lets talk about this for a moment: Why is the sea level decreasing in Sweden? As you seem to be implying, if sea ice was truly melting, we should be seeing an increase in sea levels, not a decrease. As such, it could be assumed that this information would indicate that this is actually not the case.
But would that explanation be accurate, or is there an alternate explanation?
As luck would have it, your first example happened to be from one of the rare countries that are not seeing a sea level increase, so this would imply that there are other factors at work.
So what is it?
Well, actually both Sweden and Finland are in fact experiencing increasing sea level along with the rest of the world, they are just experiencing a rise in the land which is working faster than that sea level rise. The reason for this rise in the land, is called "post-glacial uplift", which is the rebounding of a landmass after the weight of ice is lifted. This has been going on in these areas since the last ice age ended about 10,000 years ago. As such, this data isn't really evidence of much in regards to whether a loss of ice mass is contributing to sea level rise.
-----------------------------------------------------------------------------------
I would also like to note that you should not be making comments about trends without utilizing trend lines. What you refer to as "stagnation" is just a subjective reading of a mass of data. There is a reason we utilize maths to make statements about trends. Maths are better at it than our subjective interpretations and what we feel we see in data.
For an example, look at the Cuxhaven data you posted. Your subjective interpretation told you that there was "stagnation" after about 1970. The definition of stagnation would imply that this would mean that there is no trend in the data, but if we apply a trend line to the data, we see that is not the case:

I trimmed the data from 1980 to the newest data point in 2018 (to give some wiggle room for your estimation of when the sea level stopped rising) and you can see clearly from the included trend line (as calculated by the software), that the sea level actually rose about 110mm over this time frame, which fits very closely with the commonly accepted estimation of a sea level rise of about 1/8inch (or 3.175mm) per year.
Last edited by sundin13 - on 16 February 2020


