


happydolphin on 06 March 2012
|
RolStoppable said: Yeah, try this. It should lead to fairly straight lines between the actual data points. I really want to see the blue line starting with SMB, not somewhere above SMB2 where it makes no sense. |
I agree. Here is what I got.
Data (with manual interpolations):
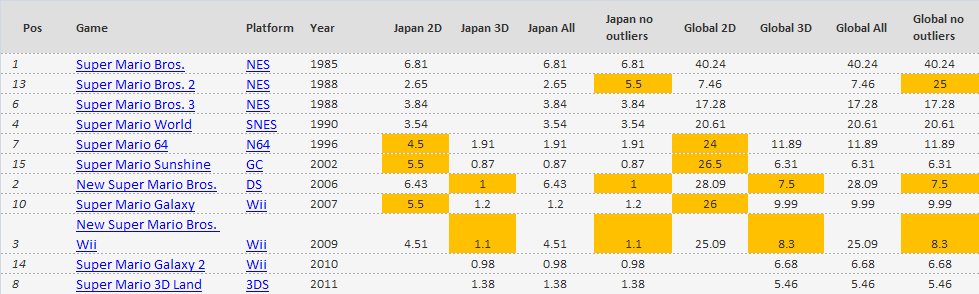
Below trends are in perspective, so a flat trend segment would line up with the gridlines that are along the chart title.
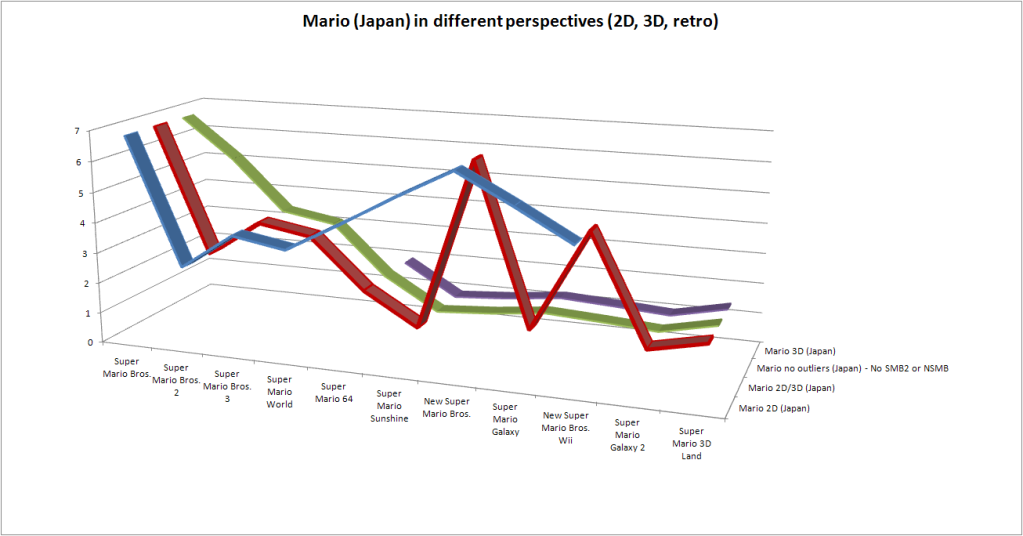
Japan Trends:
Global Trends:
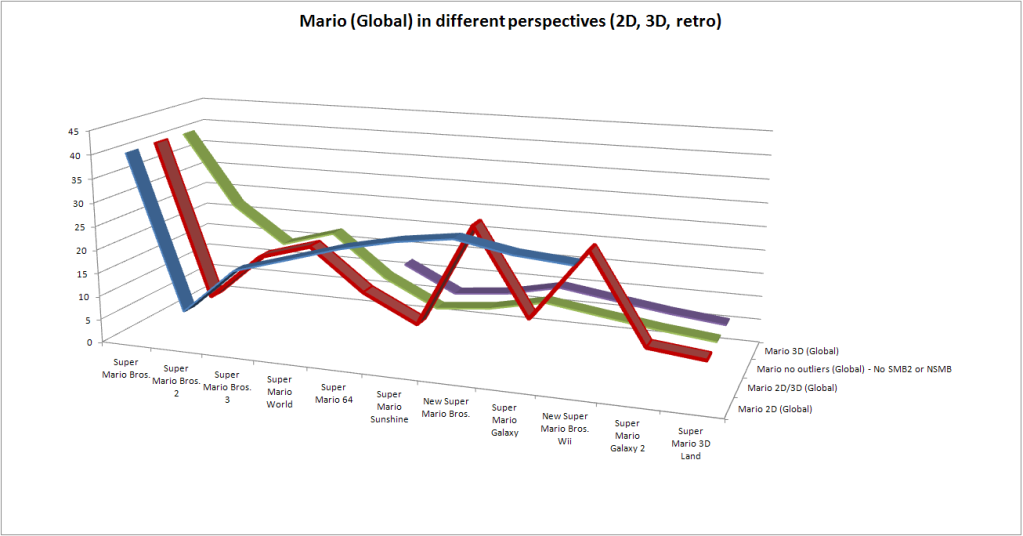
Keep in mind, in the blue trend above (Mario 2D Global), Only SMB and SMW were bundled. The others were not (of course, you know that).