


Sqrl on 07 September 2007
jhlennon1 said:
These are the figures from Media Create. So if he has typed it wrong, everybody has.
Hardware - This Week | Last Week | YTD | LTD 1. NDS - 94,339 | 100,460 | 5,189,516 | 19,195,195 2. WII - 39,371 | 46,283 | 2,590,150 | 3,509,793 3. PSP - 22,196 | 26,089 | 1,369,666 | 5,901,795 4. PS3 - 18,068 | 16,393 | 661,922 | 1,119,480 5. PS2 - 14,280 | 15,139 | 546,074 | 20,700,933 6. 360 - 1,635 | 2,044 | 141,358 | 406,060 7. GBA - 474 | 651 | 45,770 | 15,343,849 8. NGC - 73 | 116 | 9,465 | 4,178,933 |
Not sure why we are using the MC number only considering the site we are on, but thats fine they are reliable enough for me. So no big deal.
Anyways back on topic: If you look one week further back you see this for MC #'s....
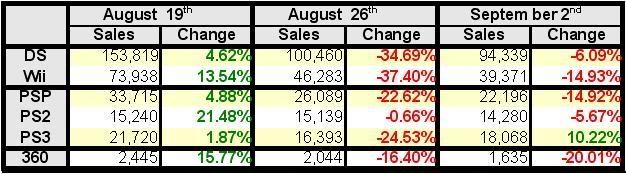
This shows pretty clearly that all consoles were up in sales 3 weeks ago and have gone down the last two weeks with the exception to a 10% correction for the PS3. This clearly goes deeper than just a Wii issue alone.
Edit: Right click and "View Image" to see the portion cut off.
 |
| To Each Man, Responsibility |