Hedra42 said:
SvennoJ said:
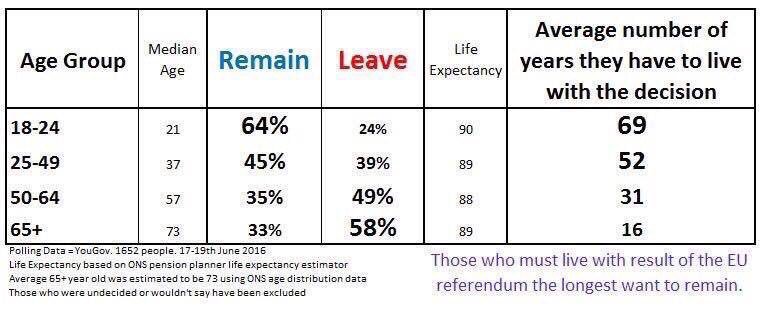
Indeed, this picture says it all
Now I wonder what percentage of each age group turned out to vote.
With an important decision like this with results this close, a re vote should be in order.
|
I posted most of these facts in response to that picture already:
First, there was no exit poll.
Second, this picture is extrapolated from a poll of 1652 people on 17th-19th June. And we all know the way VGChartz works. :P
Demographic polls showed the profile of a Remain voter was most likely a 24 year old female graduate living in Scotland, while the profile of a typical Leave voter was a 60 year old male skilled labourer living in East Anglia.
It wasn't so much the age of people but their distribution that was remarkable in this vote - the Remains were more or less all in London or in Scotland. Interestingly, the turnouts in Scotland were 67% which was below the average UK turnout of 72%, and significantly below the Scottish Independence referendum, when 84% turned out.
Lots of people didn't vote because they were rolling around in mud in Glastonbury. Lots of other people didn't vote because they were wading around their flooded homes.
Could Glastonbury and the bad weather have made a difference? If more Scottish voters turned out, would it have made a difference? If Northern Ireland, Wales or England had been playing in the Euro football that evening, would that have made a difference?
Who knows...
|
Yeah it says that in the picture, doesn't say how many were undecided, just excluded.
And for all your other reasons a re-vote should be in order. 72% turnout and a margin like that.
I wonder if Quebec is going to try again. In 1995 it was a similar close margin, yet in favor of staying. Except it's been going further down since, last year it was 64% in favor of staying. Perhaps if the UK had waited a bit it would have been the other way around.