Oh a global warming debate! This could be fun! And I would appreciate it if for the remainder of the thread you used the picture below as reference when you are forming a mental image of me explaining my position:
One of my favorite uncomfortable facts to point out about global warming is how incredibly powerful it really is. In fact it is so powerful that it can warp the very fabric of space and time violating causality and have its effect on the earth's environment before the C02 even begins to rise! Incredible, and certainly a good reason for anyone with any respect for the power of the almighty theory of global warming to join the religion and donate today!
Joking aside, global warming as a theory actually does violate causality in a couple of ways, but the most striking example is as follows:
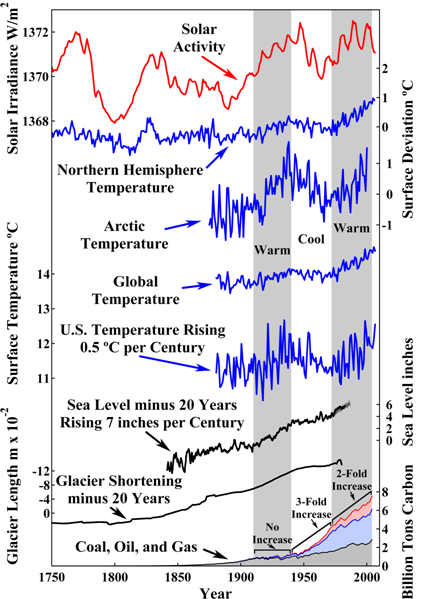
See the problem is very simply that human hydrocarbon usage (seen at bottom of graph and presented by US DoE's C02 Analysis Center at Oak Ridge) did not actually start in any meaningful quantity until the early 1900's and even then the real increase didn't start until around 1945. The problem is that the glacier shortening and the sea level (both of which lag temperature indicators) trends started upwards well before this human hydrocarbon usage even began. But even more disjointed is the decrease in temperature and the lulls in glacier shortening and sea level increase while the hydrocarbon usage was undergoing a tripling in a matter of only 20 years or so. The data does not fit hydrocarbon use at all, so you can't even really say that hydrocarbon usage has a correlation (which is what the theory of AGW actually states as opposed to Atmospheric C02 which is usually graphed and actually does have a scientific correlation to temperatures independent of human factors).
What we see above and presented in the theory of AGW is of course impossible because it requires us to believe that cause comes before effect (ie a contradiction of the principle of causality) and it is simply impossible for a C02 increase tomorrow to cause a temperature increase yesterday. It doesn't happen folks.
The place where we've gone wrong with AGW is in the models, the specific issue is that the models are of an inherently chaotic environment where it is currently a technical impossibility to correctly seed the model with accurate data. What I mean by that is that the models attempt to predict global climate over long periods of time based on a starting input and a set of rules implemented by the model designer. The rules themselves are extremely difficult to tune into a working model but the problem with accurate input is necessarily incomplete because with our current data collection system it is not possible to have accurate measure of every input simultaneously for accurate use in the models.
But the problem with models actually goes well beyond this even. Models don't work for the exact same reason you mock your local forecaster. Yes, that is right, because we cannot accurately handle local short-term forecasts we cannot predict climate. This probably makes sense to most but to those still questioning lets take a look at what is widely regarded as the biggest weakness in climate models, namely the inability to predict clouds!
Please do not take my word for it though, you can read from Steven Goddard an excellent explanation of why the current models contain a substantial margin for error simply because of clouds. This explanation also highlights some of the common mistakes made by my fellow skeptics and in general is a very informative and well balanced article. The relevant bit to this discussion specifically however I will post below with a quick paraphrased explanation first.
Essentially short wave radiation enters the atmosphere where ~20% of it is absorbed by clouds and emitted back into space as long wave radiation. About 50% of the short wave radiation reaches the earth and while it all eventually finds its way back into space the increase in GHGs causes an increased number of collisions as it finds its way back out. Subject to thermodynamics the temperature in the earth system must increase to account for the radiation that has yet to escape. Now as you might imagine the presence of clouds, their composition, volume, etc..etc.. plays a major role in determining where that 20% number actually comes in on a given day and is crucial for models to accurate predict the GHE. But perhaps even more interesting and not addressed in Goddards article is the fact that solar activity itself actually plays a large role in cloud formation. The effect is that high solar activity has a reducing effect on cloud formation and reduces the amount of short wave radiation that is reflected back into space before it can be “trapped” (term used loosely), while low solar activity has an increasing effect on cloud formation and thus the reduced short wave radiation meets even more resistance from the clouds than it usually does. For those who aren't clear on this solar activity occurs in cycles of around 11 to 13 years and it is relatively consistent within a given cycle.
Now to what Goddard himself wrote:
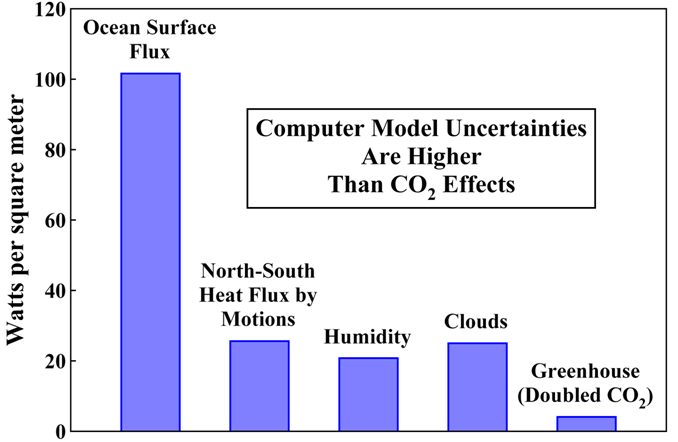
Suppose that the amount of reflected SW from clouds increases from 20% to 21%? That would cause a significant cooling effect. Thus the ability of GCM models to model future temperatures is largely dependent on the ability to model future clouds. Cloud modeling is acknowledged to be currently one of the weakest links in the GCMs. Given the sensitivity to clouds, it is perhaps surprising that some high profile climate scientists are willing to claim that 6C+ temperature rises are established science.
Or to put this visually:

The radiative greenhouse effect of doubling the concentration of atmospheric CO2 (right bar) as compared with four of the uncertainties in the computer climate models.
So having already shown that AGW violates causality and shown how and why clouds invalidate computer modeling as a basis for sweeping legislative and lifestyle changes in it's current highly error prone form, perhaps we should talk a bit about the precautionary principle? For those who don't know the precautionary principle is the idea that we should prepare even if we are unsure...JUST IN CASE!! Of course this has the unfortunate side effect of stalling out developing 3rd world countries who are trying to modernize and bring their countries the kind of wealth we enjoyed from exploiting our natural resources...but now we're telling them they can't do that because we think...maybe...possibly..there just might...eventually be some global warming (which as I will show shortly isn't even a bad thing). The effect is that millions of impoverished people must wait in poverty simply because we aren't so sure its such a good idea.
But beyond that it actually is a very good thing for the environment.....or had you not considered that a “Greenhouse Effect” might be beneficial for plants?
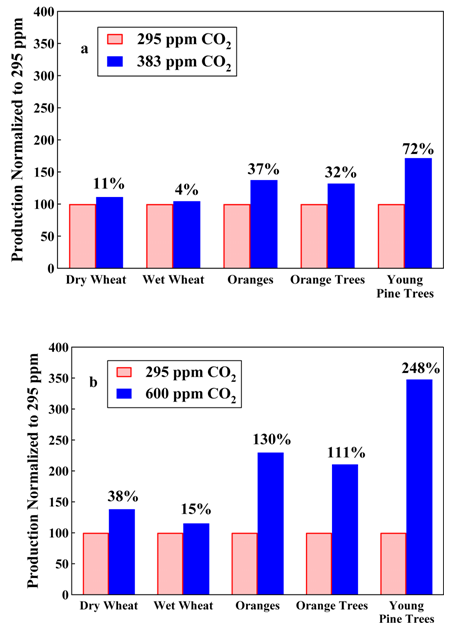
A doubling of C02 would actually be a good thing for the world's starving as wheat, orange trees, and countless other plants would all benefit greatly and yield better crops for feeding our growing population. But for those who have taken some basic life science course at some point in their life probably know the process of photosynthesis is as follows: “carbon dioxide + water + light energy → carbohydrate + oxygen + water “. This means (for the laymen) that C02 is tkaen in by the plants (along with water and light) and produces water (byproduct), Oxygen(byproduct) , and food (for the plant). In effect photosynthesis is negative feedback to C02 increases.
You might then say “Ok ok...but wait just a minute Sqrl...surely everyone knows that Global Warming is causing our climate to be chaotic! It even caused Hurricane Katrina!!”
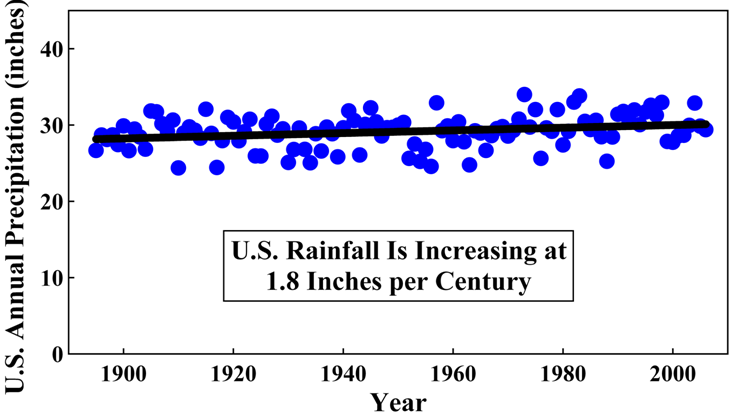
Aah ok, well let us look at what the effect has truly been, surely rain has increased, yes?
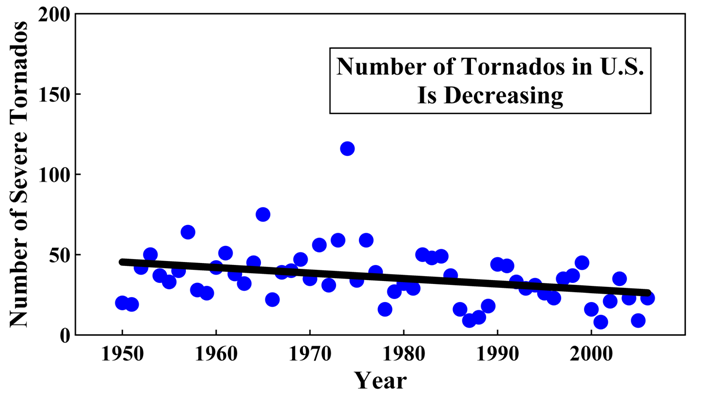
You: "Hmm, no? Ok then well I'm confident that we should see some of this increase in Tornadoes! Yes, that must be it!"
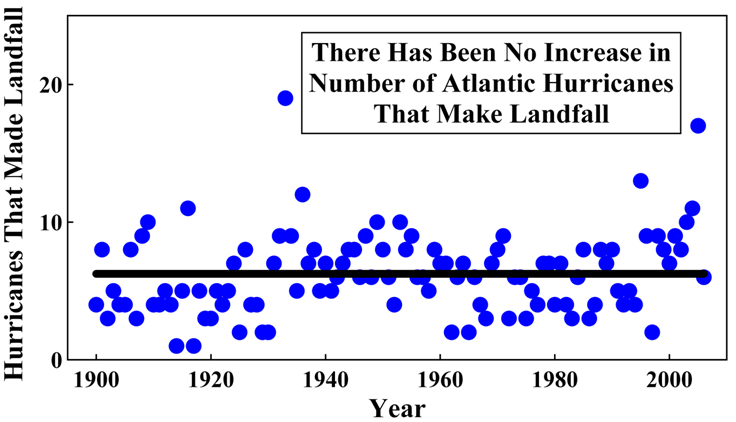
You: "Darn! Ok then what about those hurricanes! See you tried to avoid hurricanes and show us tornadoes and rainfall! We've got you now!!"
You: "Oh oh I see what you're doing here...there aren't any MORE hurricanes....but the ones there are are significantly stronger aren't they!!!??"
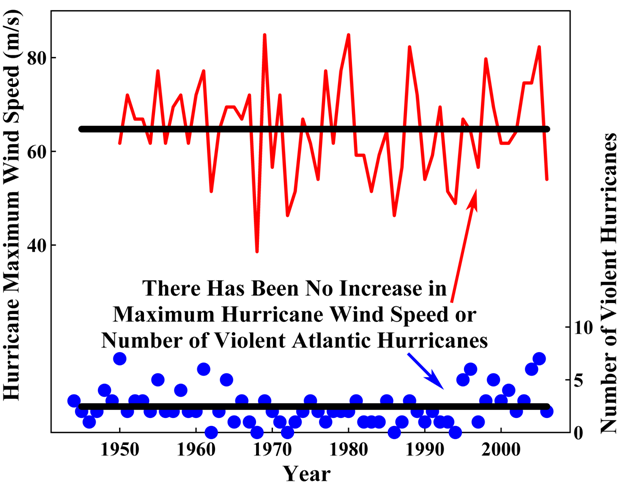
You: "/gulp, how about earthquakes?...."
Me: "Well said imaginary person helping to make my dramatic point."
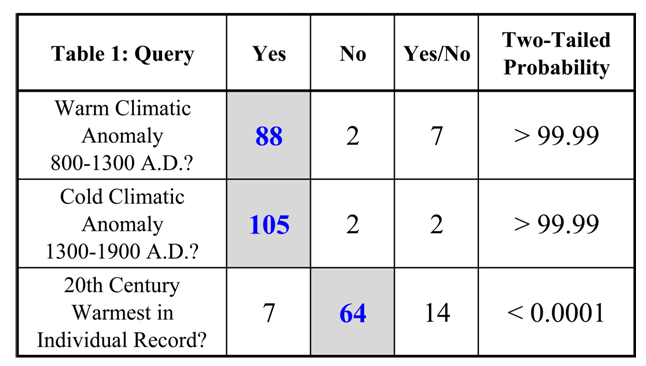
Recently the physicists at the American Physical Society have decided to re-open the “settled” issue of AGW and take a look at just what the heck is going on. They concurred with Mr Steven Goddard and Dr Richard Lindzen who is a Sloan Professor of Meteorology at MIT who both find cause to greatly question climate modeling and consider it to be a cornerstone of alarmist dogma. As for the conclusion APS reached, well it can be well summed up by this quote:
"The IPCC's methodology relies unduly — indeed, almost exclusively — upon numerical analysis, even where the outputs of the models upon which it so heavily relies are manifestly and significantly at variance with theory or observation or both. Modeled projections such as those upon which the IPCC's entire case rests have long been proven impossible when applied to mathematically-chaotic objects, such as the climate, whose initial state can never be determined to a sufficient precision. For a similar reason, those of the IPCC's conclusions that are founded on probability distributions in the chaotic climate object are unsafe.
Not one of the key variables necessary to any reliable evaluation of climate sensitivity can be measured empirically. The IPCC's presentation of its principal conclusions as though they were near-certain is accordingly unjustifiable. We cannot even measure mean global surface temperature anomalies to within a factor of 2; and the IPCC's reliance upon mean global temperatures, even if they could be correctly evaluated, itself introduces substantial errors in its evaluation of climate sensitivity. .The IPCC overstates temperature feedbacks to such an extent that the sum of the high-end values that it has now, for the first time, quantified would cross the instability threshold in the Bode feedback equation and induce a runaway greenhouse effect that has not occurred even in geological times despite CO2 concentrations almost 20 times today's, and temperatures up to 7 ºC higher than today's."
|

Hansen (1988) projected that global temperature would stabilize (A) if global carbon dioxide concentration were controlled from 1988 and static from 2000: otherwise temperature would rise rapidly (B-C). IPCC (1990) agreed (D). However, these projections proved well above the National Climate Data Center’s outturn (E-F), which, in contrast to the Hadley Center and UAH records (Fig. 1), show a modest rise in temperature from 1998-2007. If McKitrick (2007) (G,H) is correct that temperature since 1980 has risen at only half of the observed rate, outturn tracks Hansen’s CO2 stabilization case (A), although emissions have risen rapidly since 1988. |
This conclusion is not uncommon and in fact indicates what skeptics have been pointing out for years (although these men certainly say it with a great deal more authority due to their credentials). Honestly anyone who has glanced at the image below probably immediately had doubts after noticing that the earth which is commonly claimed to be at ~400 ppm has commonly been above 4,000 ppm (ppm = parts per million for those unsure).

Of course this all makes sense if you noticed in Goddard's GHE explanation linked above that C02 has a logarithmic contribution to the GHE as a GHG, as you can see below:

In fact from ~400 ppm all the way up to 1200 ppm, we would see an increase of ~2.5C according to Charnock & Shine which have the most pessimistic model presented here. For comparison the least pessimistic model predicts only a 1C increase in temperature from that tripling of atmospheric C02 which is a doubling of the 600 ppm people are truly alarmed about. Oh and did I mention that these increases in temperature are based on the extremes of the model above? Specifically the high extreme.
But looking back at the image before last (historic atmospheric C02 plotted against temperature) it should be clear to you that C02 is not the driver of a positive feedback because if it were the several thousand ppm C02 concentrations would have runaway. For those laymen still reading this long boring post I should point out that a positive feedback is one in which the thing being increased produces yet more increase and the result unchecked is a runaway variable which increases ever faster. This of course fails to make sense from a purely logical standpoint by our very existence and the empirical data supports this with a stable temperature despite relatively chaotic C02 concentrations.
It is for these reasons that much of the real debate in global warming has nothing to do with the GHE or Sun (because the sun is obviously involved as it is the source of the radiation being trapped, denying this is like trying to prove you have fingers attached to your body but insisting your palm has nothing to do with it and should not be considered). This is the subject of Dr Lindzen's most recent guest post on WUWT where he makes the case that the feedbacks predicted by alarmist models are actually in defiance of undeniable observable evidence. It is a bit more involved than I would like to get into here (and I'm not 100% clear on it yet myself), so I will provide a link for those unmoved by what I've already provided and still interested to read more (for whatever reason).
I'll leave it off with an amusing quote from the end of Goddard's guest article on WUWT:
“Lisa, in this house we obey the laws of thermodynamics“
- Homer Simpson
edit: (My last link was to the wrong article and the article I intended is actually a 114 page physics paper so I made a slight modification, same effect though and actually it fits much better than what I had originally intended anyways).