I get alot of good info from this site, so I figure it's time I give something back. I always like to look at market share by quarter. This data came from vgc so I figure this kind of belongs here.
Some notes on the data:
I compiled quarterly data from weekly data by lumping the week with the quarter's end date into each quarter (i.e. Q4 08 was 10/5/08 to 1/3/09).
I included WW and NA data only, Others data can be inferred by looking at these two. This just happens to be what I look at, so that's what's here.
| Wii | PS3 | X360 | Gen | ||||||||
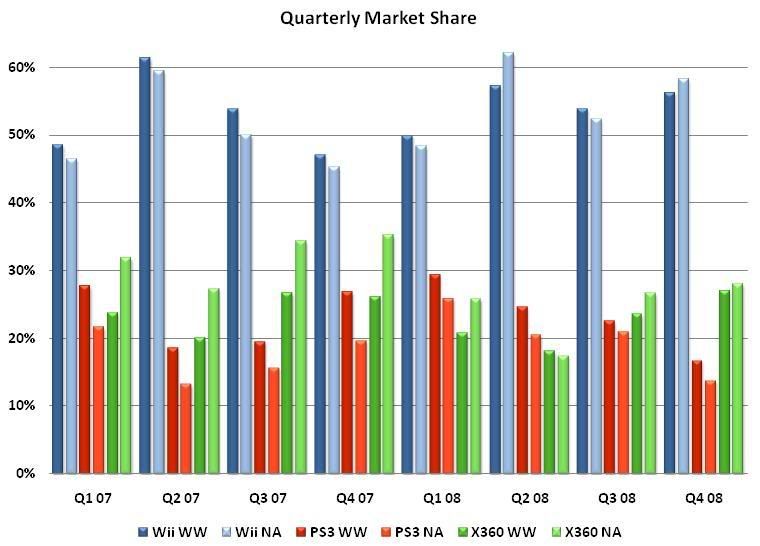
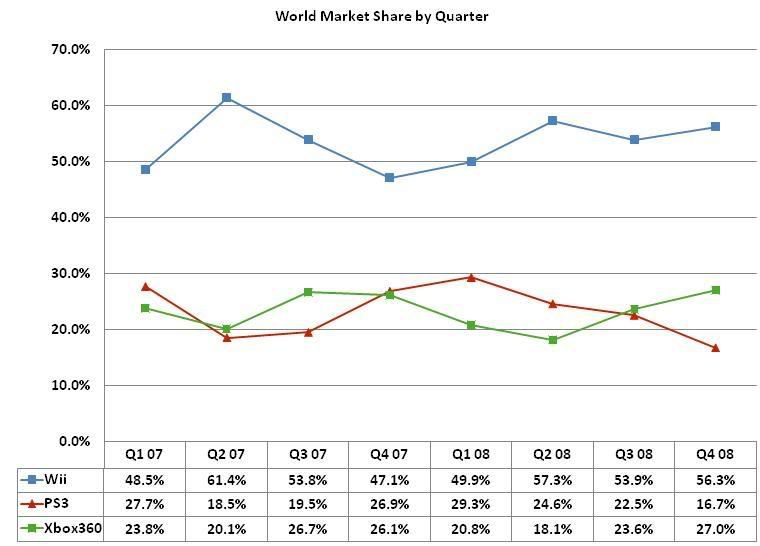
| Q1 07 | WW | 2,504,238 | 48.5% | 1,429,767 | 27.7% | 1,226,501 | 23.8% | 5,160,506 | |||
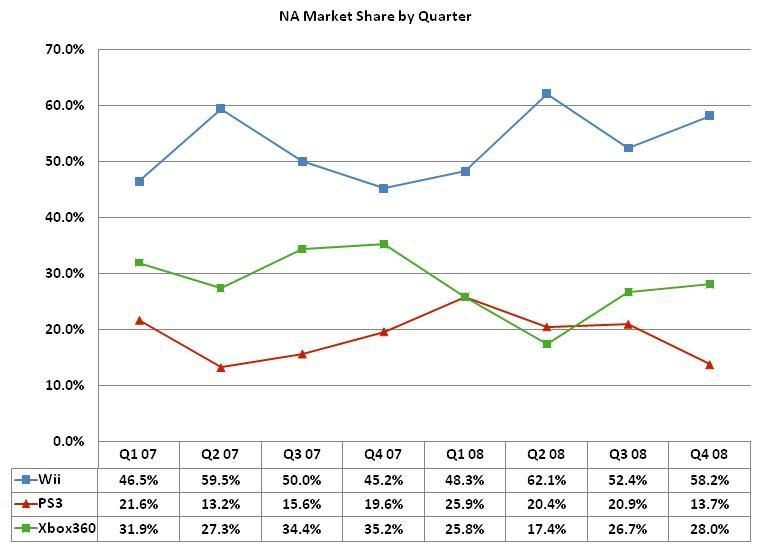
| NA | 1,011,799 | 46.5% | 470,545 | 21.6% | 694,296 | 31.9% | 2,176,640 | ||||
| Q2 07 | WW | 3,140,187 | 61.4% | 947,582 | 18.5% | 1,025,974 | 20.1% | 5,113,743 | |||
| NA | 1,381,721 | 59.5% | 306,452 | 13.2% | 635,119 | 27.3% | 2,323,292 | ||||
| Q3 07 | WW | 3,496,287 | 53.8% | 1,264,710 | 19.5% | 1,733,626 | 26.7% | 6,494,623 | |||
| NA | 1,655,814 | 50.0% | 517,486 | 15.6% | 1,137,640 | 34.4% | 3,310,940 | ||||
| Q4 07 | WW | 7,264,337 | 47.1% | 4,144,209 | 26.9% | 4,020,605 | 26.1% | 15,429,151 | |||
| NA | 3,419,431 | 45.2% | 1,481,641 | 19.6% | 2,660,870 | 35.2% | 7,561,942 | ||||
| Q1 08 | WW | 4,132,127 | 49.9% | 2,427,717 | 29.3% | 1,721,606 | 20.8% | 8,281,450 | |||
| NA | 1,629,661 | 48.3% | 872,224 | 25.9% | 871,076 | 25.8% | 3,372,961 | ||||
| Q2 08 | WW | 5,610,721 | 57.3% | 2,408,530 | 24.6% | 1,775,402 | 18.1% | 9,794,653 | |||
| NA | 2,551,331 | 62.1% | 839,664 | 20.4% | 715,362 | 17.4% | 4,106,357 | ||||
| Q3 08 | WW | 4,408,152 | 53.9% | 1,843,056 | 22.5% | 1,927,674 | 23.6% | 8,178,882 | |||
| NA | 1,781,170 | 52.4% | 710,390 | 20.9% | 905,747 | 26.7% | 3,397,307 | ||||
| Q4 08 | WW | 12,196,269 | 56.3% | 3,622,765 | 16.7% | 5,852,796 | 27.0% | 21,671,830 | |||
| NA | 6,377,527 | 58.2% | 1,501,998 | 13.7% | 3,070,875 | 28.0% | 10,950,400 | ||||
| 07-08 | WW | 42,752,318 | 53.4% | 18,088,336 | 22.6% | 19,284,184 | 24.1% | 80,124,838 | |||
| NA | 19,808,454 | 53.2% | 6,700,400 | 18.0% | 10,690,985 | 28.7% | 37,199,839 |
Here's my take on the trends:
Wii
08 went as follows: weak Q1 (50%), strong Q2 (57%), moderate-weak Q3 (54%), and moderate-strong Q4 (56%). 07 followed the same trend with the exception of Q4 (47%), which was the Wii's worst quarter to date. In theory, the weak Q4 07 may be because Wii was supply constrained and could not meet the increased holiday demand, but I won't commit to that theory unless 09 ends up showing the same trend as 08.
PS3
07 went as follows: strong Q1 (28%), weak Q2 (19%), weak Q3 (20%), strong Q4 (27%). 08 started off the same, with Q1 (29%) being the strongest quarter to date, but the trends from there on were much different: moderate-strong Q2 (25%), moderate-weak Q3 (23%), and weak Q4 (17%).
Comparing the launch of Wii to PS3, Wii did a better job of carrying momentum. However, the weakness in Q2 & Q3 07 for PS3 may have been more the result of Wii's growth rather than an indication of a weakness in PS3 sales.
Xbox360
07 went as follows: moderate-strong Q1 (24%), weak Q2 (20%), strong Q3 (27%), strong Q4 (26%). The overall trend was very similar in 08, with Q2 as the weakest quarter, and Q3 & Q4 as the strongest. The differenences were small: moderate-weak Q1 (21%), weak Q2 (18%), moderate-strong Q3 (24%), strong Q4 (27%).
One thing that stands out with the 360 is that its NA market share was much worse in 08 than 07, and therefore their Others performance was much better (since WW was about equal). This may reflect a change in marketing focus.