By using this site, you agree to our Privacy Policy and our Terms of Use. Close

Forums - Sales - September 2026 VGChartz Estimates Thread

Ns1 sold 53.6k in row this month according to vgc , 10.72k weekly.
Amazing durability.
The most spectacular though is ps5 sales IN europe,which led it to have 1m+ IN September at that "age".
For me the member kyuu has given a very enlightening explanation about that.
Users stuck on ps4 finally migrating, since more and more major titles cease to release on it.

Last edited by tak13 - 1 day ago

Around the Network
tak13 said:

I made that question in another thread.

Repeating it to specific person who may knows.
Trunks, the upcoming Nintendo FY26-27Q2 will cover the 5 weeks of September or the for or rather be as of the final day of the quarter, 30th of September.
What the past indicates, q bit lazy to check that too. 😵‍💫

I'm not exactly sure what yo are asking. Companies earnings reports cover specific months so the latest one will cover July 1 to September 30. This does mean our estimates will include an extra 3 days in October compared to the earnings reports.


VGChartz Sales Analyst and Writer - William D'Angelo - I stream on Twitch and have my own YouTube channel discussing gaming sales and news, as well as posting random gaming content. Follow me on Bluesky.

I post and adjust the VGChartz hardware estimates, with help from Machina.

Writer of the Sales Comparison | Monthly Hardware Breakdown | Monthly Sales Analysis | Marketshare Features, as well as daily news on the Video Game Industry.

JRPGfan said:

It's nice to have it all in 1 thread like this, and easily readable (the layout and formatting).
Thanks for all the work and effort it took to do this Trunkswd.

All the monthly articles related to this are posted in this threads. While the comparison articles (ie. NS2 v NS1) are posted in another thread. Been doing this for years.


VGChartz Sales Analyst and Writer - William D'Angelo - I stream on Twitch and have my own YouTube channel discussing gaming sales and news, as well as posting random gaming content. Follow me on Bluesky.

I post and adjust the VGChartz hardware estimates, with help from Machina.

Writer of the Sales Comparison | Monthly Hardware Breakdown | Monthly Sales Analysis | Marketshare Features, as well as daily news on the Video Game Industry.

trunkswd said:
tak13 said:

I made that question in another thread.

Repeating it to specific person who may know. 
Trunks, the upcoming Nintendo FY26-27Q2 will cover the 5 weeks of September or the for or rather be as of the final day of the quarter, 30th of September.
What the past indicates, q bit lazy to check that too. 😵‍💫

I'm not exactly sure what yo are asking. Companies earnings reports cover specific months so the latest one will cover July 1 to September 30. This does mean our estimates will include an extra 3 days in October compared to the earnings reports.

Your reply shows you fathomed what i asked.

Nice, Thanks, trunks. 

3 days doesn't make such a great difference.

446k sales then IN vgc vs.... Shipments?

At least 446k? Less according to a theory that there is a contigent of reducing stock (mostly in europe) or  that there is sufficient, so shipping less. 

It sould be 500k and maybe 530k,which will bring the Shipments tally to 157.12.

Provided that  sales were 597k and Shipments 672k last time. 

Last edited by tak13 - 1 day ago

Link to the VGChartz article here.

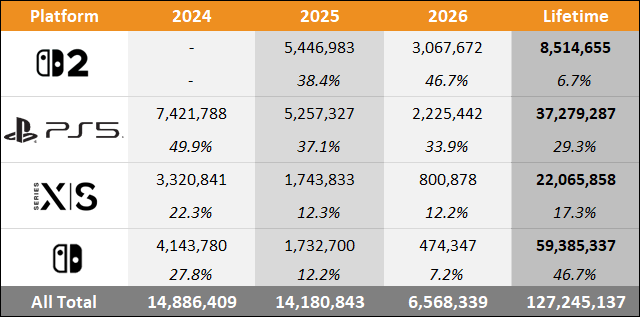
2026 Americas Sales Comparison Charts Through September - Switch 2 vs PS5 vs Xbox Series vs Switch

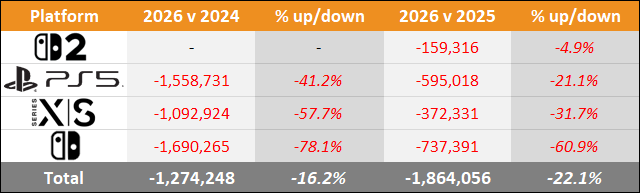
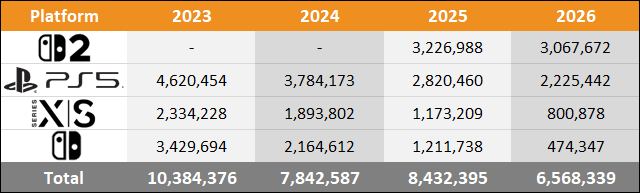
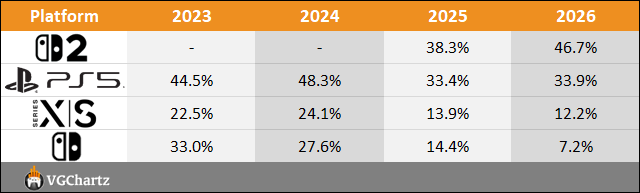
Here we see data representing the sales through to consumers and change in sales performance of the four platforms still on the market (Nintendo Switch 2, PlayStation 5, Xbox Series X|S, and Nintendo Switch 1) over comparable periods for 2023, 2024, 2025, and 2026. Also shown is the market share for each of the consoles over the same periods.

Year to Date Sales Comparison (Same Periods Covered)
Market Share (Same Periods Covered)
2023 - (January 2023 to September 2023)

2024 - (January 2024 to September 2024)

2025 - (January 2025 to September 2025)

2026 - (January 2026 to September 2026)

"Year to date" sales for 2023, 2024, 2025, and 2026 sales are shown in series at the top of the table and then just below a comparison of 2026 versus 2025 and 2026 versus 2024 is displayed.  This provides an easy-to-view summary of all the data.

Total Sales and Market Share for Each Year
Nintendo

  • Nintendo Switch 2
    • 3.06 million units sold year-to-date
    • Down year-on-year 0.16 million units (-4.9%)
  • Nintendo Switch 1
    • 0.47 million units sold year-to-date
    • Down year-on-year 0.74 million units (-60.9%)

Sony

  • PlayStation 5
    • 2.23 million units sold year-to-date
    • Down year-on-year 0.60 million units (-21.1%)

Microsoft

  • Xbox Series X|S
    • 0.80 million units sold year-to-date
    • Down year-on-year 0.37 million units (-31.7%)

Note: VGChartz 2026, 2025, and 2023 estimates through September includes 39 weeks, while 2024 estimates includes 40 weeks.


VGChartz Sales Analyst and Writer - William D'Angelo - I stream on Twitch and have my own YouTube channel discussing gaming sales and news, as well as posting random gaming content. Follow me on Bluesky.

I post and adjust the VGChartz hardware estimates, with help from Machina.

Writer of the Sales Comparison | Monthly Hardware Breakdown | Monthly Sales Analysis | Marketshare Features, as well as daily news on the Video Game Industry.