


A few notes before we begin:
- This thread is purely about stats and interpretation of those stats. Trolls and those unwilling to use their heads to do a bit of thinking can just leave the thread now.
- All stats are based on VGC weekly numbers and are focused on the 3 current consoles.
- All data for the most recent quarter (Oct-Dec '07) is incomplete but shown anyways. Keep this in mind when you analyze.
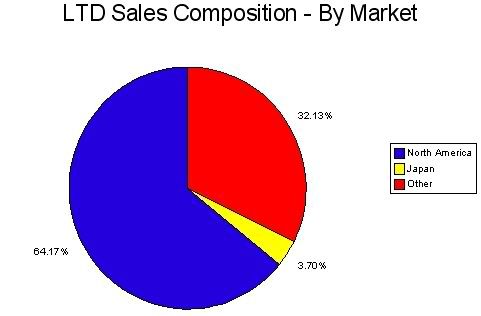
- The data is broken down by console, but there are a few charts on market share at the end.
- edit: Some of the pictures run off the right edge of the screen. To view them in their entirety just right click on them and select "View Image" (Firefox users).
Sony's Playstation 3
| Weekly | Statistics |
| Mean | 110,835 |
| Median | 87,382 |
| Standard Deviation | 79,334 |
| Worst Week | 49,162 |
| Best Week | 586,389 |
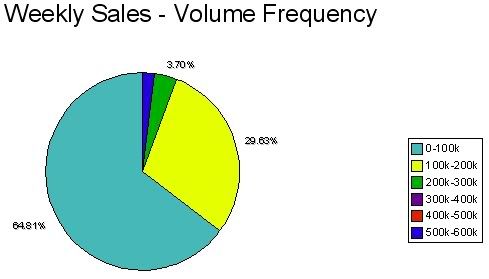
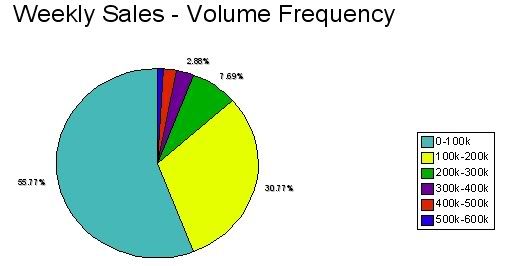
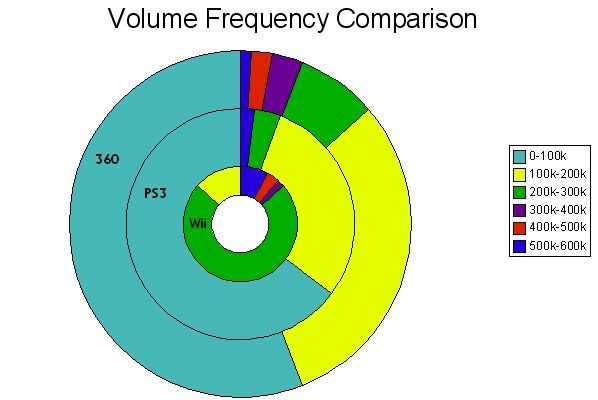
| Units Sold | Frequency | Relative Frequency |
| 0-100k | 35 | 0.65 |
| 100k-200k | 16 | 0.3 |
| 200k-300k | 2 | 0.04 |
| 300k-400k | 0 | 0 |
| 400k-500k | 0 | 0 |
| 500k-600k | 1 | 0.02 |
| Totals: | 54 | 1.00 |
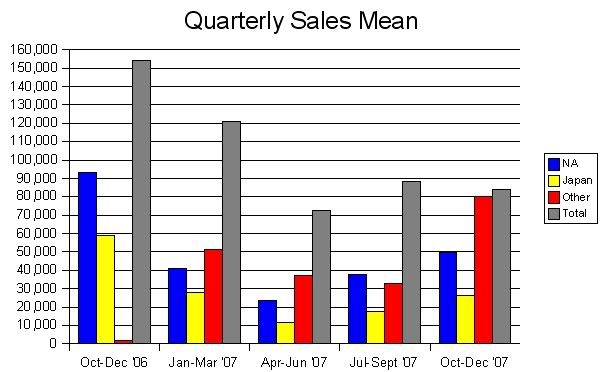
| Mean | Sales | |||
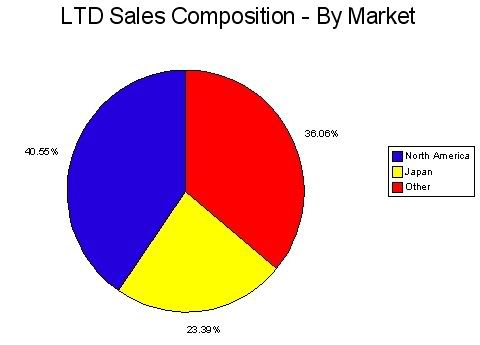
| Quarter | NA | Japan | Other | Total |
| Oct-Dec '06 | 93,332 | 59,076 | 1,673 | 154,080 |
| Jan-Mar '07 | 41,045 | 28,108 | 51,631 | 120,784 |
| Apr-Jun '07 | 23,573 | 11,482 | 37,345 | 72,400 |
| Jul-Sept '07 | 37,766 | 17,493 | 32,935 | 88,194 |
| Oct-Dec '07 | 49,931 | 26,430 | 80,005 | 156,366 |
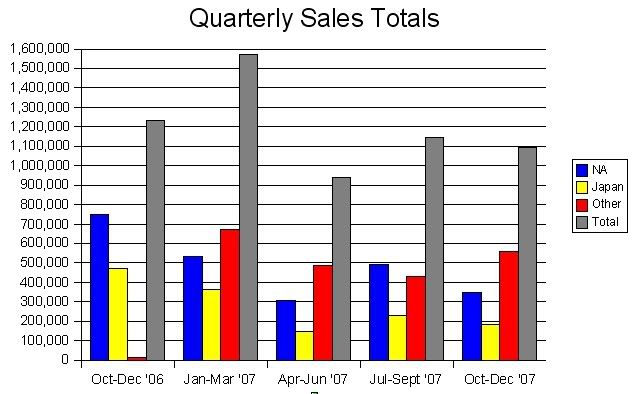
| Total | Sales | |||
| Quarter | NA | Japan | Other | Total |
| Oct-Dec '06 | 746,653 | 472,605 | 13,385 | 1,232,643 |
| Jan-Mar '07 | 533,585 | 365,399 | 671,206 | 1,570,190 |
| Apr-Jun '07 | 306,452 | 149,260 | 485,490 | 941,202 |
| Jul-Sept '07 | 490,962 | 227,405 | 428,149 | 1,146,516 |
| Oct-Dec '07 | 349,519 | 185,013 | 560,033 | 1,094,565 |
Microsoft's XBox 360
| Weekly | Statistics |
| Mean | 128,580 |
| Median | 95,390 |
| Standard Deviation | 87,930 |
| Min | 61,539 |
| Max | 566,638 |
| Units Sold | Frequency | Relative Frequency |
| 0-100k | 58 | 0.56 |
| 100k-200k | 32 | 0.31 |
| 200k-300k | 8 | 0.08 |
| 300k-400k | 3 | 0.03 |
| 400k-500k | 2 | 0.02 |
| 500k-600k | 1 | 0.01 |
| Totals: | 104 | 1.00 |
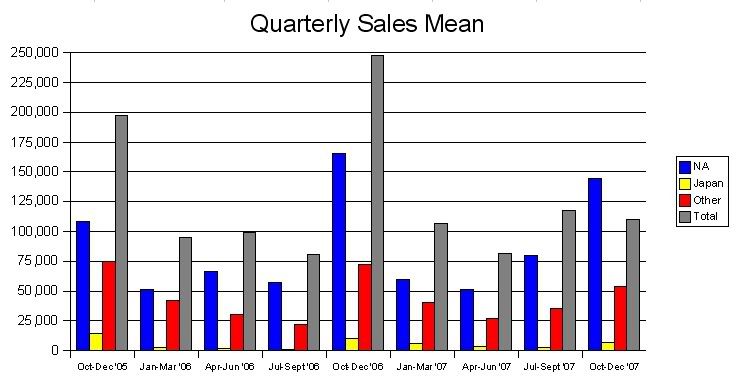
| Mean Sales | ||||
| Quarter | NA | Japan | Other | Total |
| Oct-Dec '05 | 108,556 | 14,171 | 74,536 | 197,263 |
| Jan-Mar '06 | 51,047 | 2,526 | 41,779 | 95,352 |
| Apr-Jun '06 | 66,246 | 1,904 | 30,610 | 98,760 |
| Jul-Sept '06 | 57,469 | 1,292 | 21,897 | 80,658 |
| Oct-Dec '06 | 165,661 | 9,780 | 72,171 | 247,611 |
| Jan-Mar '07 | 60,071 | 6,321 | 40,381 | 106,773 |
| Apr-Jun '07 | 51,394 | 3,403 | 26,854 | 81,652 |
| Jul-Sept '07 | 79,755 | 2,785 | 35,041 | 117,581 |
| Oct-Dec '07 | 144,552 | 6,741 | 53,627 | 204,920 |
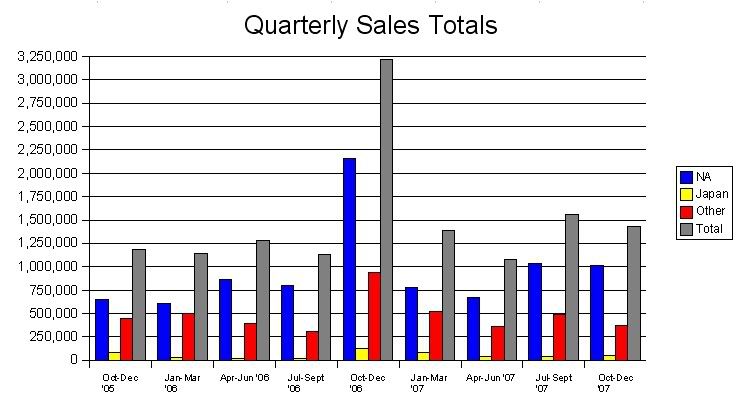
| Total Sales | ||||
| Quarter | NA | Japan | Other | Total |
| Oct-Dec '05 | 651,336 | 85,023 | 447,218 | 1,183,577 |
| Jan-Mar '06 | 612,563 | 30,314 | 501,349 | 1,144,226 |
| Apr-Jun '06 | 861,201 | 24,754 | 397,924 | 1,283,879 |
| Jul-Sept '06 | 804,572 | 18,083 | 306,560 | 1,129,215 |
| Oct-Dec '06 | 2,153,591 | 127,140 | 938,217 | 3,218,948 |
| Jan-Mar '07 | 780,924 | 82,173 | 524,953 | 1,388,050 |
| Apr-Jun '07 | 668,124 | 44,241 | 363,663 | 1,076,028 |
| Jul-Sept '07 | 1,036,812 | 36,210 | 487,372 | 1,560,394 |
| Oct-Dec '07 | 1,011,862 | 47,188 | 375,387 | 1,434,437 |
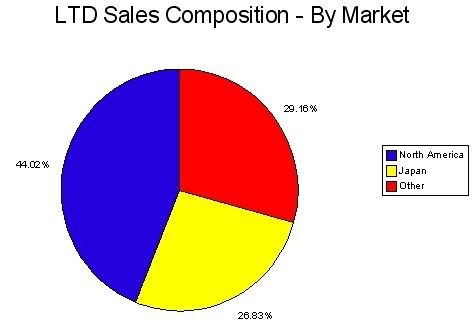
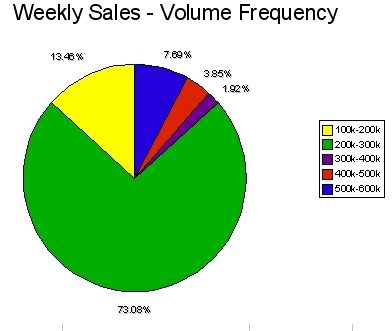
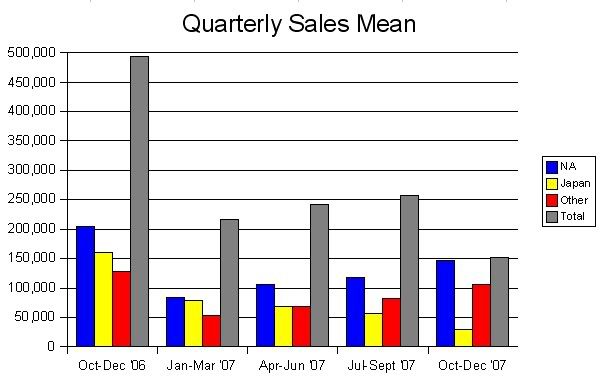
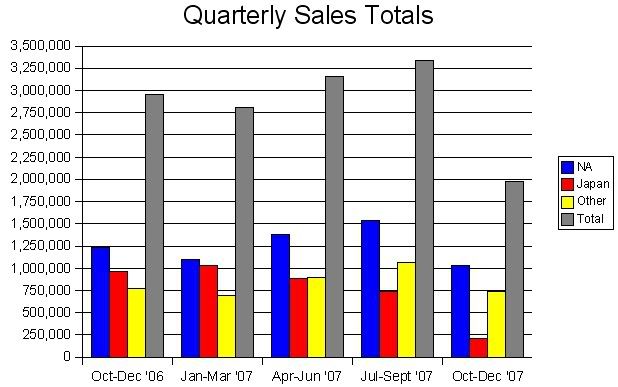
Nintendo's Wii:
| Weekly | Statistics |
| Mean | 274019 |
| Median | 247934 |
| Standard Deviation | 98509 |
| Min | 151111 |
| Max | 596702 |
| Units Sold | Frequency | Relative Frequency |
| 100k-200k | 7 | 0.13 |
| 200k-300k | 38 | 0.73 |
| 300k-400k | 1 | 0.02 |
| 400k-500k | 2 | 0.04 |
| 500k-600k | 4 | 0.08 |
| 52 | 1.00 |
| Mean Sales | ||||
| Quarter | NA | Japan | Other | Total |
| Oct-Dec '06 | 204,818 | 159,859 | 128,598 | 493,275 |
| Jan-Mar '07 | 84,171 | 79,139 | 53,099 | 216,409 |
| Apr-Jun '07 | 106,286 | 67,944 | 68,472 | 242,701 |
| Jul-Sept '07 | 118,556 | 57,005 | 81,585 | 257,146 |
| Oct-Dec '07 | 146,543 | 30,049 | 105,978 | 282,569 |
| Total Sales | ||||
| Quarter | NA | Japan | Other | Total |
| Oct-Dec '06 | 1,228,908 | 959,153 | 771,588 | 2,959,649 |
| Jan-Mar '07 | 1,094,229 | 1,028,813 | 690,281 | 2,813,323 |
| Apr-Jun '07 | 1,381,721 | 883,268 | 890,130 | 3,155,119 |
| Jul-Sept '07 | 1,541,225 | 741,063 | 1,060,610 | 3,342,898 |
| Oct-Dec '07 | 1,025,798 | 210,340 | 741,844 | 1,977,982 |
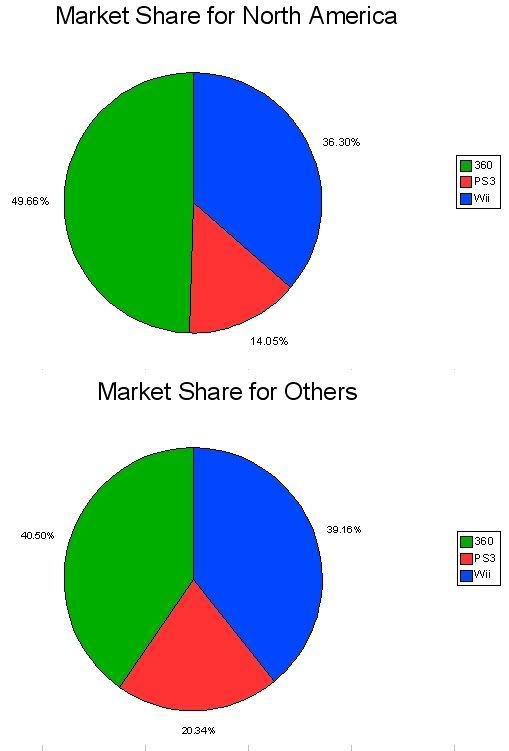
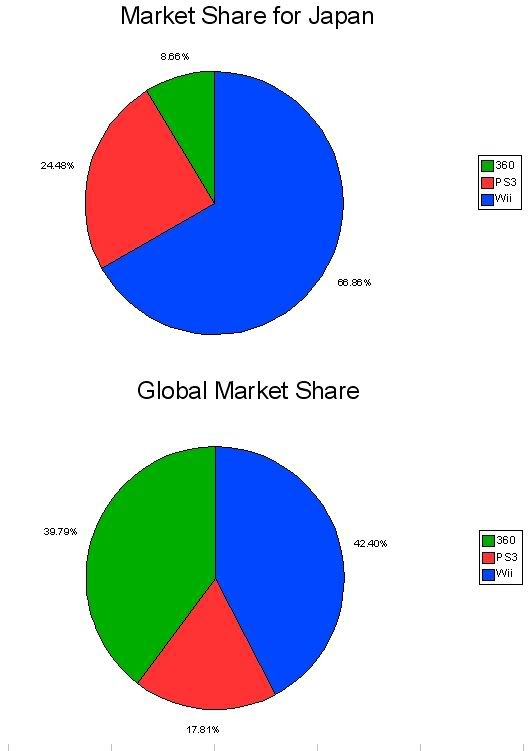
Comparisons:
(Here you go Super_Etecoon)
Ok, well originally I had intended to do a summary here, but it took me a really long time to get all this data into this form. I'd appreciate it if a few folks could write up an analysis, particularly if you notice something surprising or worth discussing.
PS - Let me know if any of my data is off.
 |
| To Each Man, Responsibility |


