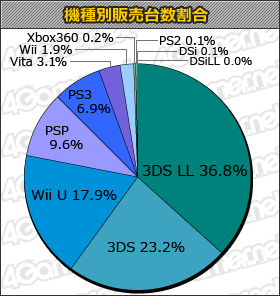
sperrico87 said:
|
| Model | Sales volume |
| 3DS LL |
251,949 |
| 3DS |
159,323 |
| Wii U |
122,843 |
| PSP |
65,859 |
| PS3 |
47,626 |
| Vita |
21,266 |
| Wii |
13,049 |
| Xbox 360 |
1,689 |
| PS2 |
928 |
| DSi |
454 |
| DSi LL |
291 |

|
Combined, Nintendo hardware makes up for more than 80% of the Japanese video games market. Does anyone have any historical info at their disposal to see if there's been another period where they've been so dominant? Perhaps Wii/ DS peak in '07/'08?
|

This is a really old graph I've made some years ago. The 2010 numbers aren't correct (made in mid 2010) and the Sega numbers have been collected using shipped consoles instead of actual sales data but there you go. I should make a new one maybe...