


Hi guys, to celebrate the arrival of the sales tools back on VGChartz, I wanted to begin with 2 graphs I found interesting while tinkering around.
But before I do, I want to give a big shout out at my friends prof, linkz, Carl, Kowen, ethomaz, noname, trucks and other great friends that helped push the sales tools, and a big thanks to ioi for giving us the start of something big.
Here they are:
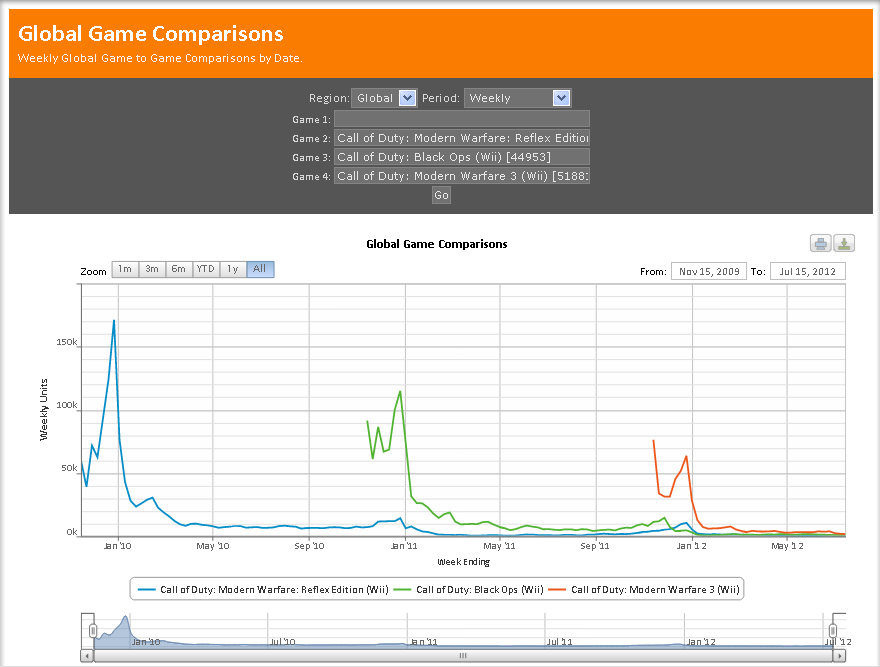
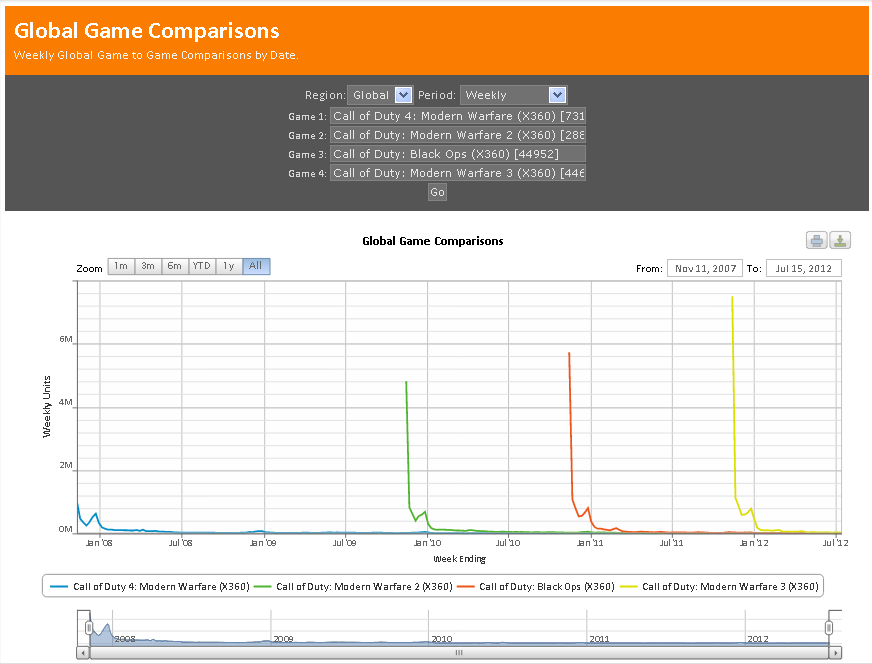
So, the graphs represent the evolution of the COD series on the 360 (main COD platform) and the devolution of the COD series on the Wii.
There are reasons for this we are all pretty familiar with at this point, but I just thought the graphs made a point pretty strongly and are very accurate at showing the explosive growth of COD at MW2, and then the upward trend on the 360, the converse of which happened for the Wii. It's nice to see what we know drawn out before our eyes.