VGAnalyz Series: Episode 02
HW Sales by Manufacturer, by gen for North America
Hello ladies and gentlemen and welcome to my second entry in my biggest project on VGChartz: the VGAnalyz Series. (logo to come  . Anyone good with photoshop or logos I would greatly appreciate the help)
The idea, the purpose
The idea of this series is to present the data we have in different perspectives. These perspectives are meant to pull meaning from the data where the traditional representations fail to.
This Entry
This will be very similar to last entry. I have segmented the platform sales by generations and by manufacturer, and graphed them for the region of NA. Enjoy.
The Study
Sales performance per gen per manufacturer, Region: North America
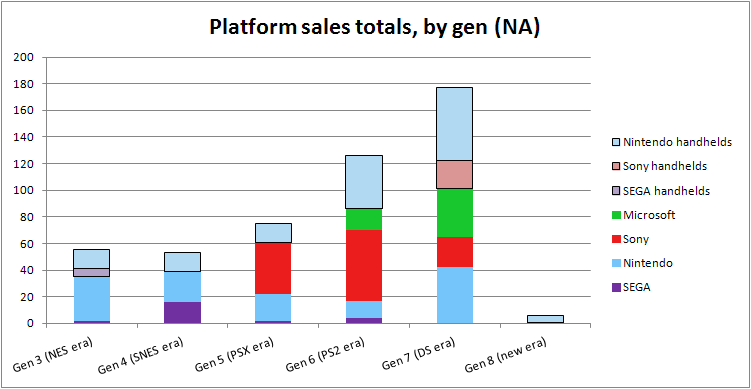
For my first study, I have assembled the sales per manufacturer, and separated home offerings from handheld offerings, and separated them by generation. Below is the graph.

*Master System data taken from Wikipedia
** Game Boy data includes Game Boy Color and was amortized linearly over gens 3 to 5 (lifespan of GB was 1989 to 2003)
Study:
Handhelds:
(Copy-paste from Ep01, so you can skip this handhelds section if already read  )
)
As you can see, handheld sales have been healthy from the get-go. Nintendo being the main provider of handheld offerings mostly up until gen 6 (most other offerings bar Game Gear did not contribute much to total sales in NA), the handheld market really boomed in NA as of the DS, and subsequently, but less significantly, the PSP.
Home offerings:
Gen 3 was mostly a Nintendo market. The quasi totality of the home console front was captured by Nintendo. However, when gen 4 came along, the SEGA Genesis managed to capture a good share of Nintendo's market (around 41%). Thus, Nintendo (due to competition from first SEGA, then Sony), trended downwards from gens 3 to 6 (NES to Cube).
As of Gen5, Sony stepped in and absorbed all of SEGA's marketshare, a portion of Nintendo's marketshare, and expanded the market on its own. With that, Sony caused the HW totals to jump from around 40M to 60M sold.
Moving into Gen 6, sony continues its dominance as SEGA fights for one last time, and manages a total sales number of 4M after an abysmal performance with the Saturn. Meanwhile, MS joins the fray and manages to capture some of the market, even surpassing Nintendo's share by 3.22M. Sony ends gen 6 in NA with a record 53.65M sold. Never again will a console reach such sales heights in NA (not even the Wii).
The tables turn in Gen 7. Sony's share is reduced to 22M PS3 units (closer to MS and Nintendo sizes from gen 6). Meanwhile, Nintendo grabs a big portion of the market with a booming launch and mid-cycle performance, now trending at 42.55M. But Nintendo aren't the only ones to prosper at Sony's loss. MS comes in, for its 2nd generation in the market, and manages a massive 36.65M units sold (of course this is ongoing).
While Sony pushed the market to totals of 85.87M in Gen 6, the big 3 mostly by the hands of Nintendo and MS, manage to expand the market to a total number of 101.32M units sold (altogether) in North America.
Total:
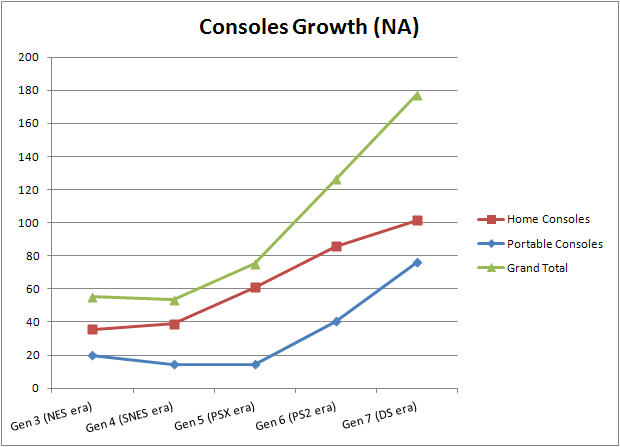
Looking at the total sales the growth of the dedicated console market is tremendous. Below is the growth curve:

Comparison to Europe:
North America's column graph is different from Europe's mostly in gens 3, 5, 6 and 7.The main reasons are that:
- In Gen 3, Nintendo really dominated NA, whereas in Europe, SEGA maintained a good 45% of the market.
- In Gen 5, Nintendo had really lost alot of relative marketshare to its competitors, holding only 6.35M of the total 44.38M sold in Europe that gen, accounting for 14% of the market, while in NA, Nintendo managed to secure almost 33% of the total marketshare against Sony's entry.
- In Gen 6, Microsoft did little to counter Sony's offerings in Europe, though they did a little better than Nintendo. Still MS only held 10.7% of the 60.88M market (Nintendo only 6.6%). This stands in stark contrast with NA, where Microsoft gave a good show, snagging 18.4% of the 85.87M unit market, and Nintendo managed to barely hold on to 14.6%, but still gave a fight.
- In Gen 7, Europe really stands out for MS and Nintendo, where Nintendo manages to octuple its sales, and MS almost manages to tripple them. Also, MS and Nintendo both dominate the PS3 in NA, while in Europe, the diminishing of the PS brand was lesser, and Sony managed to keep dominance over the MS marketshare by 4M units.
Surprisingly enough, though, the Game Gear did better stateside than it did in Europe. That's quite upside down since the SEGA brand was much stronger in Europe than in NA gen 3, and the game gear released end of gen 3. Also on the handheld front, since the GBA sold twice as many copies in NA as in Europe, the handheld curve jumps much steeper for Europe from gens 6 to 7 than it does for NA. The DS boost was considerable in both NA and Europe, but to a much greater extent in Europe.
Having said all that, the total growth curve for handhelds are analogous between both regions, and the total HW sales curves are almost identical.
The reference data:

In table form (for copy-pasting - Quote post to copy paste the table):
| Platform (NA) | SEGA | Nintendo | Sony | Microsoft | Total | SEGA handhelds | Nintendo handhelds | Sony handhelds | Total | Grand Total |
| Gen 3 (NES era) | 2 | 33.49 | 35.49 | 5.4 | 14.39 | 19.79 | 55.28 | |||
| Gen 4 (SNES era) | 15.98 | 22.88 | 38.86 | 14.39 | 14.39 | 53.25 | ||||
| Gen 5 (PSX era) | 1.83 | 20.11 | 38.94 | 60.88 | 14.39 | 14.39 | 75.27 | |||
| Gen 6 (PS2 era) | 3.9 | 12.55 | 53.65 | 15.77 | 85.87 | 40.39 | 40.39 | 126.26 | ||
| Gen 7 (DS era) | 42.55 | 22.12 | 36.65 | 101.32 | 55.04 | 21.04 | 76.08 | 177.4 | ||
| Gen 8 (new era) | 5.66 | 0.25 | 5.91 | 5.91 |
Hope you found this information and these graphs helpful. Have fun discussing below!
Previous entry (go)
The same study for the region of Europe.


