
I'm following @ZhugeEX on twitter, and this fellow is posting some interesting game data from time to time! If you're interested in sales and games data, go follow him!
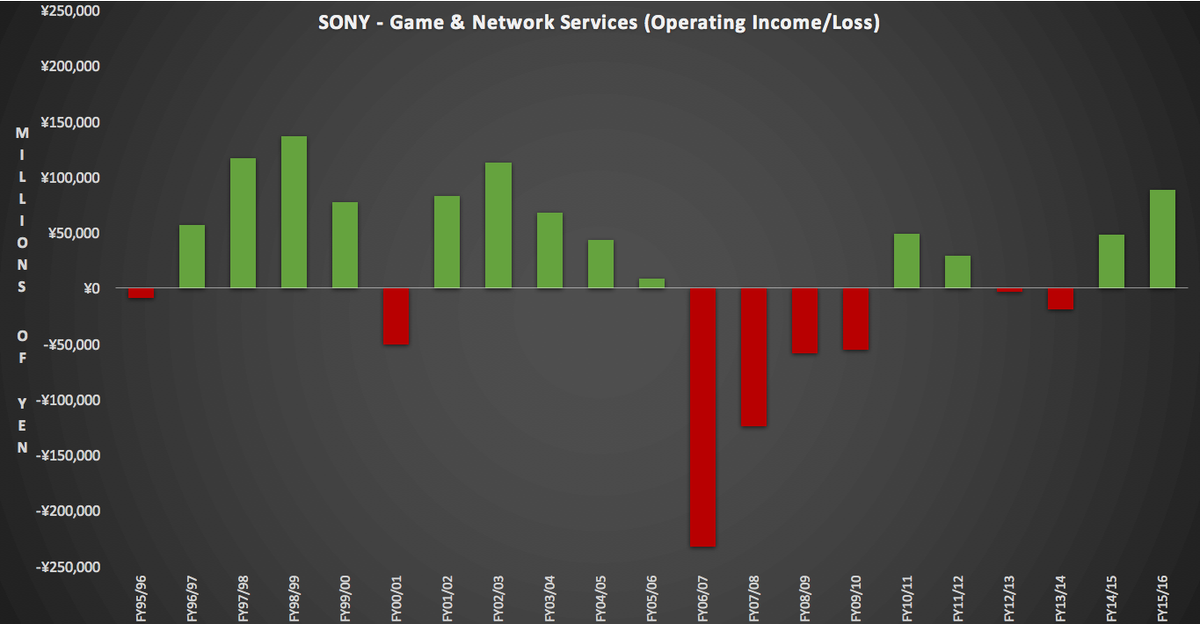
It's taken me a long time to get all this data but I finally have a Profit/Loss chart for Sony's Game division!!!!! pic.twitter.com/qE11R2TSRk
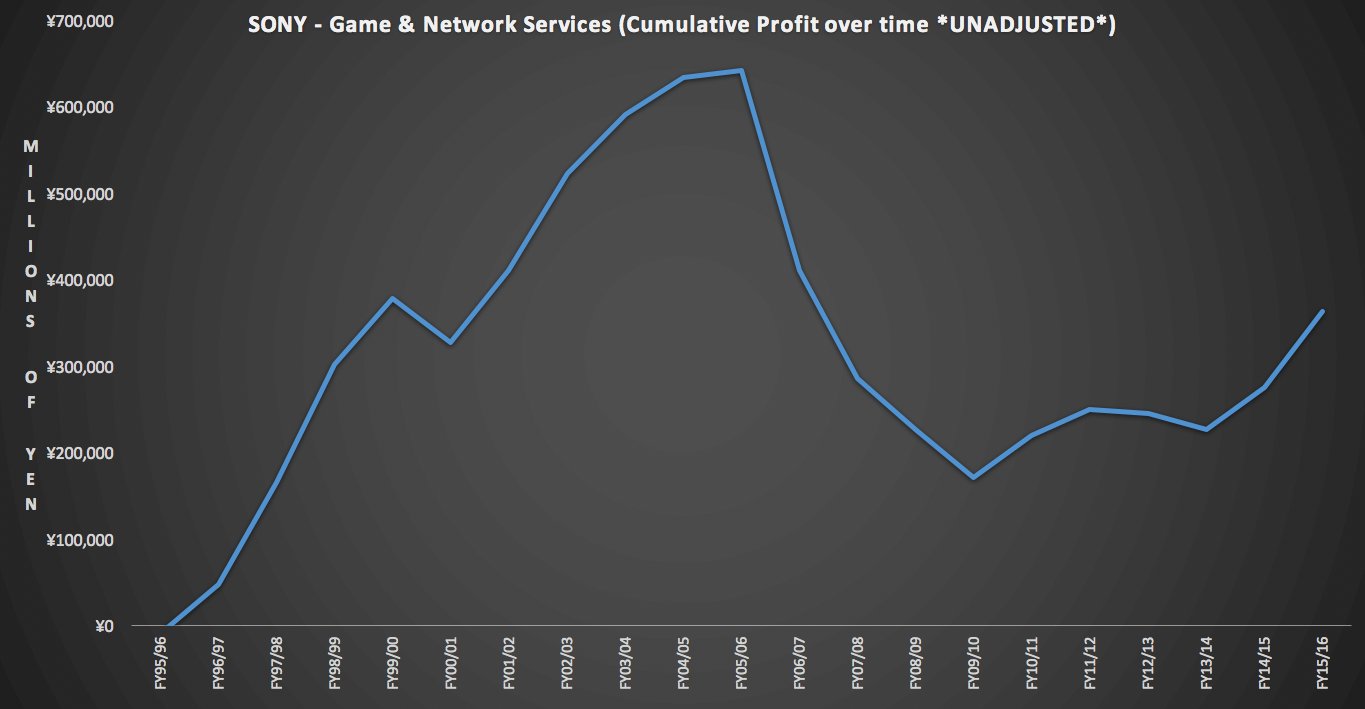
Here is a look at the cumulative profit of Sony's gaming division since FY1995.
Guess when the PS3 launched? pic.twitter.com/OBw0rcxEGx
Unadjusted for inflation
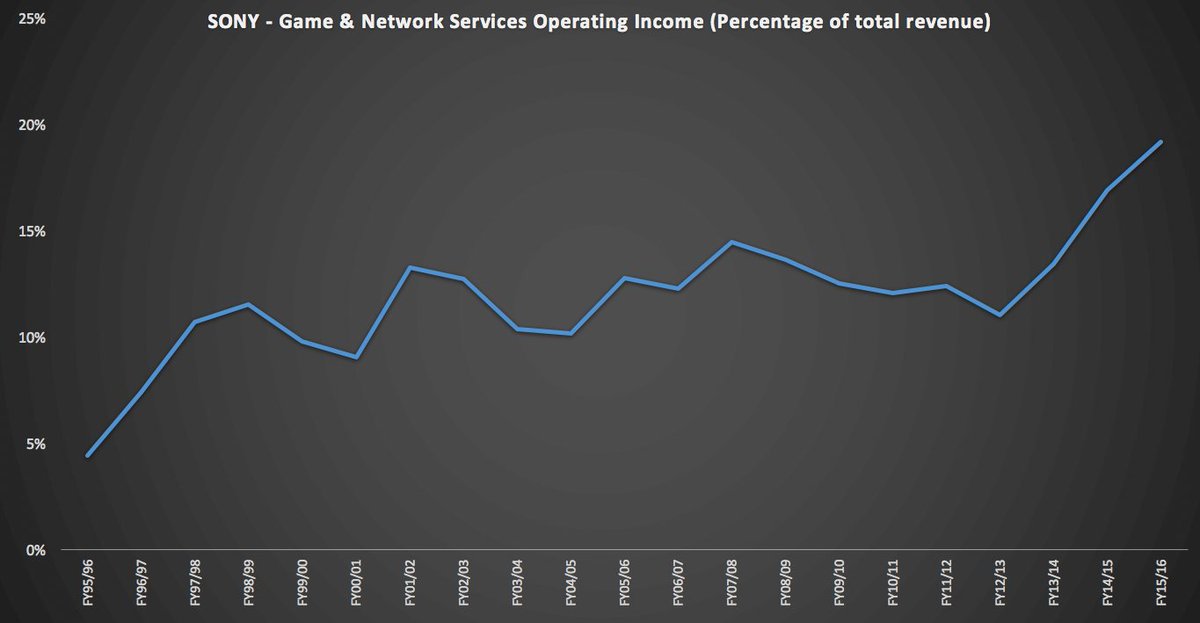
This chart shows the percentage of Sony's total revenue that is generated from the Games & Network services division pic.twitter.com/18xcGvdGMG

Realised I made a mistake on a previous chart.
Here is Sony's Game Division Net Revenues for the past 20 years. pic.twitter.com/TQar96zhcv
So here is some cool data
*
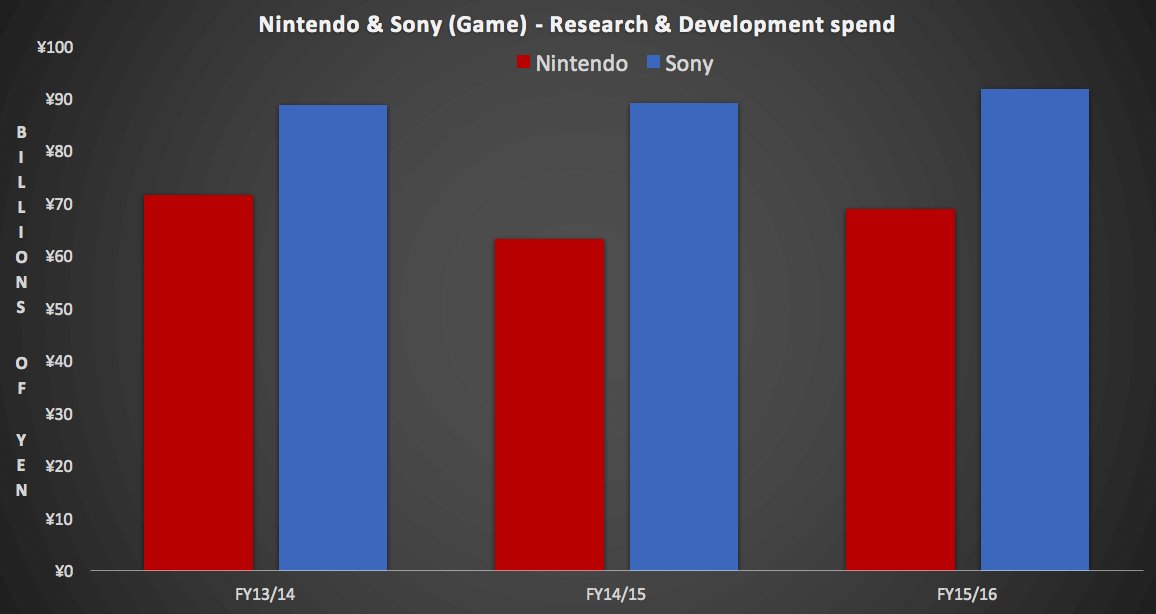
Research & Development spend from Nintendo & Sony for the last 3 years.
(Game Divisions) pic.twitter.com/paS6zYJAAK
*) Nintendo have spent an average of 12.6% of their total Net Revenue on R&D over the past 3 years, Sony have spent around 7% of their total net revenue on R&D over the past 3 years.
I don't know 'bout you, but I all of this quite interesting! I've also made a similar thread about Nintendo.
I'm on Twitter @DanneSandin!
Furthermore, I think VGChartz should add a "Like"-button.