

I'm following @ZhugeEX on twitter, and this fellow is posting some interesting game data from time to time! If you're interested in sales and games data, go follow him!
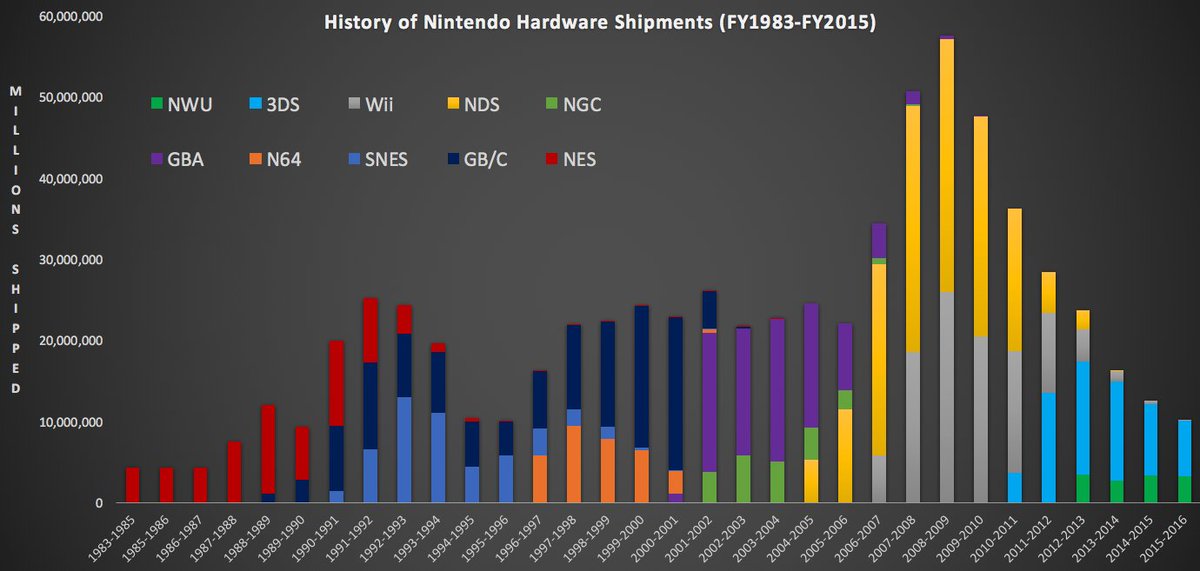
You might want to save this chart.
This is a full breakdown of sales for every Nintendo console for every year! pic.twitter.com/niam7a3xtv
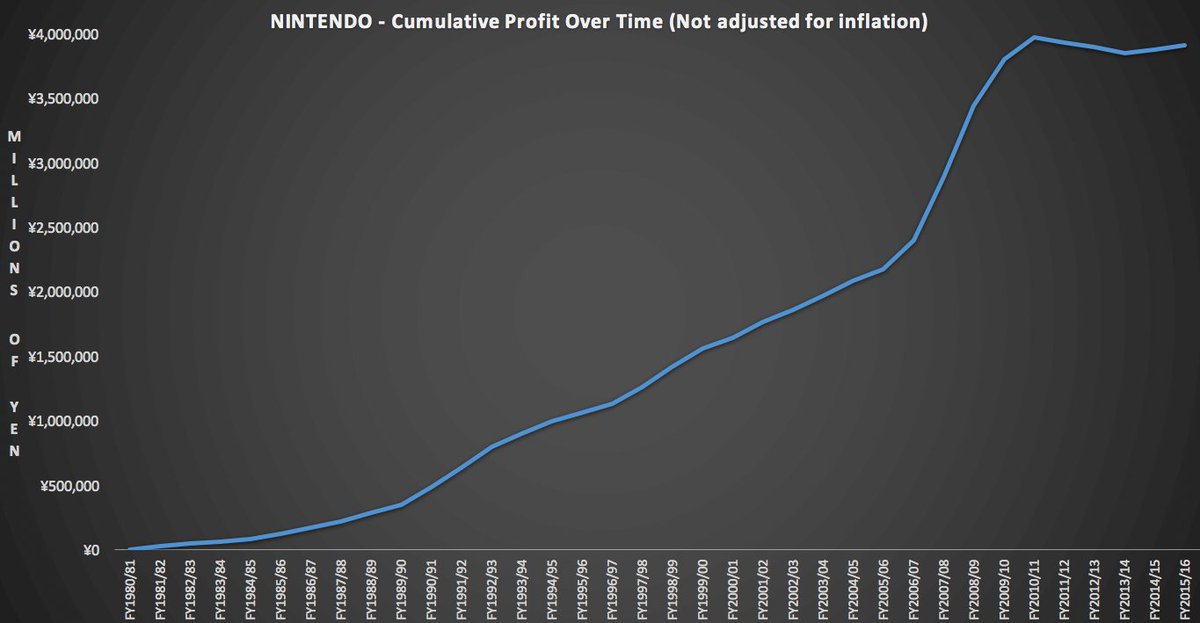
Here is a cumulative profit chart for Nintendo.
They've generated a profit every year except in the Wii U era. pic.twitter.com/atGwfmU9AT
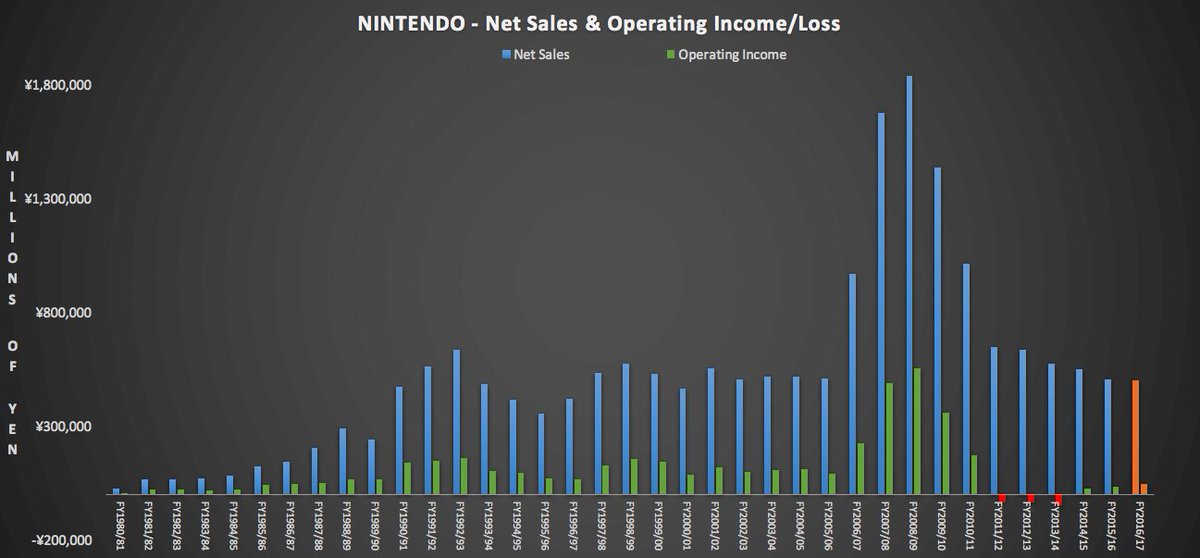
Now here is a look at Nintendo's Sales/Profit chart.
Wii era was huge
Wii U era = small losses
Orange= forecast pic.twitter.com/2gxWh9Oc5Z
So here is some cool data
*
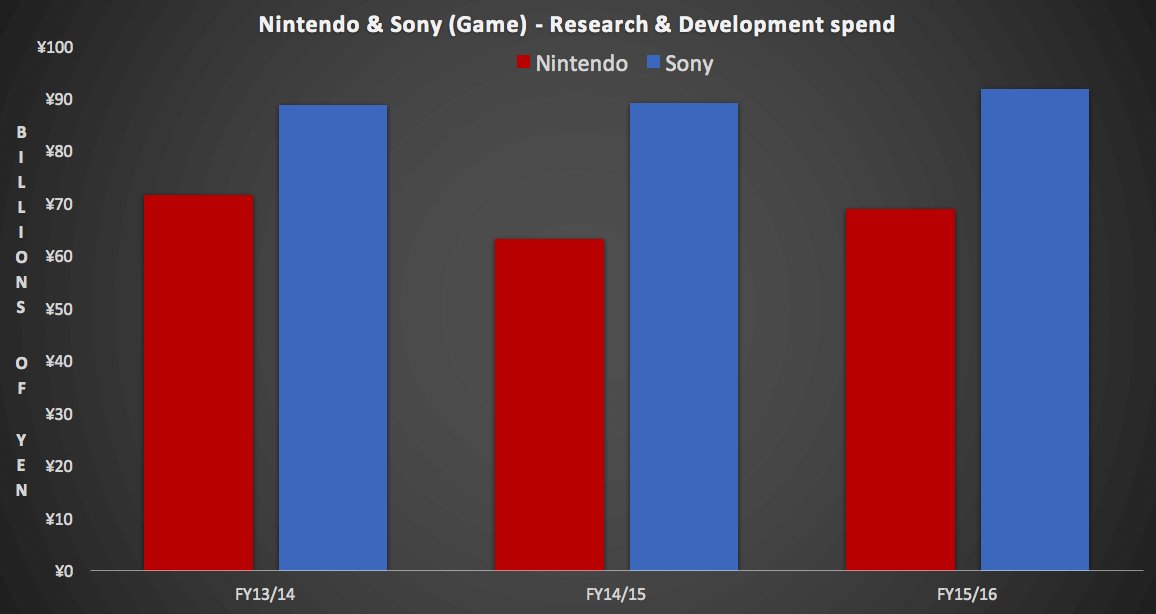
Research & Development spend from Nintendo & Sony for the last 3 years.
(Game Divisions) pic.twitter.com/paS6zYJAAK
*) Nintendo have spent an average of 12.6% of their total Net Revenue on R&D over the past 3 years, Sony have spent around 7% of their total net revenue on R&D over the past 3 years.
I don't know 'bout you, but I all of this quite interesting! I've also made a similar thread about Sony.
I'm on Twitter @DanneSandin!
Furthermore, I think VGChartz should add a "Like"-button.