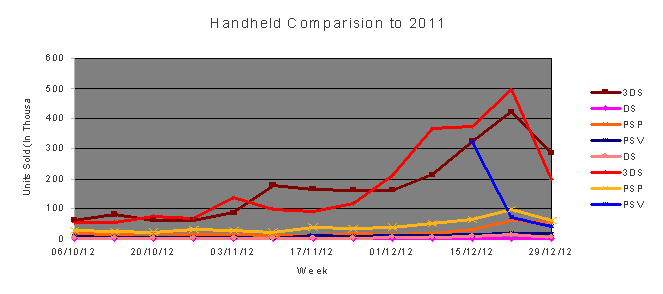
By using this site, you agree to our Privacy Policy and our Terms of Use. Close

Forums - Sales Discussion - Q4 2012 Hardware Analysis (VGC Exclusive)

Quater 4 Analysis

By: Michael-5

Hey guys, thanks for reading my Quarterly analysis. For those unfamiliar with my quarterly analysis's here are link to older software analysis's

Quarter 3 2012
Quarter 2 2012
 Quarter 3 2010
 GameTrailers Archive

I used to make these on GameTrailers before and when I first joined VGC, but now I have kind of migrated here. There is a gap between 2010 and 2012, but it's only because I would write these articles up, but never publish them.

Anyway, starting with this quarter I have decided to do something different. I am separating and expanding my Hardware analysis from my Software analysis. So expect the software analysis sometime later this week, I'm almost done it as well.

I also asked TrunkSwd if I could write these as articles on VGC, but haven't received an answer yet. So, if you like this, and think it's as good or better then VGC's own articles, go spam message him or other Administrators.

Anyway, lets begin with graphs showing hardware sales for all platforms in all regions, the graphs should be self explanitory

Platform Q4 Sales
3DS 6.38 million
360 5.67 million
PS3 5.59 million
WiiU 2.45 million
Wii 2.13 million
DS 1.64 million
PSV 1.37 million
PSP 0.71 million
PS2 0.54 million

3DS was the best selling system WW for Q4 2012, followed closely by 360 and PS3. Unlike in 2010 and 2011, the 360 was unable to recover the sales deficit it experienced during the rest of the year with PS3 this fall. Kinect's appeal has worn off. WiiU has done reasonably well, nearly keeping up with Wii's launch, and was sold out in most retailers in NA and Japan. 4th place out of 9 with only about a third the time to sell is pretty good.


Platform Q4 2011 Sales Q4 2012 Sales % Difference
360 7.52 million 5.67 million -24.6%
PS3 6.40 million 5.59 million -12.6%
WiiU N/A 2.45 million N/A
Wii 5.59 million 2.13 million -61.9%

Compared to 2011, Wii sales have fallen drastically, probably due to the lack of major software this year, and the WiiU's release. 360 sales have fallen harder then PS3's, which has resulted in an annual sales gap which favors PS3 more then any other year after 2009. In it's late years, PS3 is managing to hold its own, where 360 (and Wii) are not, so it's very likely that PS3 will take over 360 sales either temporarily or permanently in 2013-2015.

Platform Q4 2011 Sales Q4 2012 Sales % Difference
3DS 7.91 million 6.38 million -19.3%
DS 2.49 million 1.64 million -34.1%
PSV 0.48 million 1.37 million +185.4%
PSP 2.01 million 0.71 million -64.7%

Despite low sales during the year, DS has sold decently well for a system which was replaced nearly 2 years ago, outpacing the PSP and PSV. With strong sales in 2013, the DS could top PS2 sales. However, the PS2 still has some fight left, it's no garenetee. PSV only released in Japan last fall, on was only on the market for 3 weeks, so it's no wonder PSV sales have increased. 3DS sales have droped since 2011 for Q4, but are slightly up for the year. This is probably because of the $80 price cut last year, and the launch of two major software titles (Mario Kart 7 and Super Mario 3D Land). Hopefully with a strong lineup in 2013, 3DS can outpace itself for the entire year, and not just the first 10 months like in 2012. As for PSP, with the release of PSV, PSP sales have crashed.


What is with all the hate? Don't read GamrReview Articles. Contact me to ADD games to the Database
Vote for the March Most Wanted / February Results

Around the Network

Platform Q4 2012 Sales
360 3.55 million
3DS 1.90 million
PS3 1.84 million
Wii 1.132 million
WiiU 1.131 million
DS 1.04 million
PSV 0.56 million
PSP 0.06 million

PSP is basically dead in USA, and PS2 probably is too, but I can't tell for sure since VGC stopped tracking PS2 last fall. Microsoft continues to dominate in USA with it's domestic produce, but PS3 and 3DS saw respectable years. With sales from Dec 30th and 31st, Wii U probably edged out Wii for Q4 2012, which is impressive since it only had 6 weeks to sell those units and experienced shortages. DS outsold the PSV and PSP combined.

Platform Q4 2011 Sales Q4 2012 Sales % Difference
360 4.53 million 3.55 million -21.6%
PS3 2.21 million 1.84 million -16.7%
Wii 2.45 million 1.13 million -53.8%
WiiU N/A 1.13 million N/A

Wii sales have crashed in Americas and 360 sales have dropped 4.9% more then PS3's. Kinects effect have worn off and the 360 is beggining to show it's age in it's strong domestic market. All 3 7th generation console sales have dropped sizably, which is indication of an ending generation.

Platform Q4 2011 Sales Q4 2012 Sales % Difference
3DS 2.74 million 1.90 million -30.6%
DS 1.14 million 1.04 million -8.8%
PSV N/A 0.56 million N/A
PSP 0.43 million 0.06 million -86%

Wow, these numbers surprised me just now, DS only droped 8.8% from 2011 in Americas. This is probably due to the price cut to what is it now, $99? If DS can keep this up next fall, it has a chance of topping PS2 Worldwide (DS has already topped PS2 in USA/Americas regions). PSP sales have crashed, and Vita isn't doing that well either. 3DS also had a noticable drop in Q4, but annual sales are still up YoY. This is probably due to the lack of major AAA software this fall.


P.S. sorry for the incorrect title for Americas in the first graph, I would edit this if I were a writer on VGC, but this is just a forum post. I edit these graphs on a different computer and am too lazy to edit them and re-upload them


What is with all the hate? Don't read GamrReview Articles. Contact me to ADD games to the Database
Vote for the March Most Wanted / February Results

Platform Q4 2012 Sales
PS3 2.34 million
3DS 1.76 million
360 1.38 million
Wii 0.62 million
PSV 0.57 million
WiiU 0.46 million
DS 0.40 million
PSP 0.10 million

The top 3 systems are a reciprocal of USA's, with PS3 in first and 360 in 3rd. Europe is PSV's strongest region, and it shows with PSV topping DS and WiiU sales in this region. PSP is also pretty dead here, and DS isn't doing so great.


The first console labeled in the legend represents 2012 sales, the second represents 2011 sales. E.g. PS3 is Dark Blue in 2012, and Cyan in 2011.

Platform Q4 2011 Sales Q4 2012 Sales % Difference
PS3 2.63 million 2.34 million -11%
360 1.96 million 1.38 million -29.6%
Wii 1.98 million 0.64 million -67.7%
WiiU N/A 0.46 million N/A

Kind of a funny trend here, PS3 sales have barely fallen in Europe (PS3 even managed to outsell it's 2011 sales for the second week in October), 360 sales have fallen pretty hard, and Wii sales have crashed. Strong European sales are one of the reason PS3 really gained ground on 360 in WW sales this year. WiiU didn't do too well in Europe, probably because of the lack of games. NSMB Wii sold well in Europe, but Mario 2D platformers typically sell better in Americas and Japan.

The first console labeled in the legend represents 2012 sales, the second represents 2011 sales. E.g. 3DS is Dark Red in 2012 and Bright Red in 2011 (It actually sold worse in 2012 then 2011 for Q4)

Platform Q4 2011 Sales Q4 2012 Sales % Difference
3DS 2.09 million 1.76 million -15.8%
PSV N/A 0.57 million N/A
DS 0.89 million 0.40 million -55.1%
PSP 0.58 million 0.10 million -82.8%

PSP sales have utterly crashed in Europe with a drop greater then 80%. DS also fell pretty hard too. PSV was not released in Europe in 2011. 3DS also fell a modest 15.8% in Q4, but is still up YoY in Europe due to a strong Q1-3. If you look at the graph, 3DS was actually doing better then it did in 2011 up until November.


What is with all the hate? Don't read GamrReview Articles. Contact me to ADD games to the Database
Vote for the March Most Wanted / February Results

Platform Q4 2012 Sales
3DS 2.27 million
WiiU 0.64 million
PS3 0.41 million
PSP 0.30 million
PSV 0.13 million
Wii 0.077 million
360 0.025 million
PS2 0.014 million
DS 0.006 million

DS is the poorest selling console in Japan, selling less then the now discontinued (In Japan only) PS2. PSV, Wii, and 360 also sell pretty poorly, which is expected for a repeaced console like Wii, and an American console like 360. However this is worrysome for PSV, Japan should be the handhelds strongest region, but instead it's the systems weakest region by far. 3DS dominates Japanese sales, selling more then every other console combined by about 29.5%. Wii U is the second best selling console there, followed by PS3 and PSP which are both selling moderatly. PSP is outselling the PSV by more then 2:1 and it's selling nearly twice as well in Japan as it is the rest of the world. Japan marks PSP's only major hardware market.

The first console labeled in the legend represents 2012 sales, the second represents 2011 sales. E.g. PS3 is Dark Blue in 2012, and Cyan in 2011. PS2 and 360 lines are nearly impossinle to distinguish due to their overlap.

Platform Q4 2011 Sales Q4 2012 Sales % Difference
WiiU N/A 0.64 million N/A
PS3 0.52 million 0.41 million -24.1%
Wii 0.36 million 0.077 million -78.6%
360 0.027 million 0.025 million -7.4%
PS2 0.018 million 0.014 million -22.2%

Too bad Japan is such a weak market for the 360, as it dropped significantly less then any other system in Japan. Wii sales have crashed from 2011, and PS2/PS3 sales have fallen moderatly as well. Wii U dominates in its 4 weeks on sales, and will likely to continue to do so in Q1.

The first console labeled in the legend represents 2012 sales, the second represents 2011 sales. E.g. 3DS is Dark Red in 2012 and Bright Red in 2011 (It actually sold worse in 2012 then 2011 for Q4, but barely in Japan)

Platform Q4 2011 Sales Q4 2012 Sales % Difference
3DS 2.34 million 2.27 million -3%
PSP 0.54 million 0.30 million -44.4%
PSV 0.44 million 0.13 million -70.4%
DS 0.063 million 0.006 million -90.4%

3DS is the only platform to remain relatively flat from 2011 in Q4 for Japan. This is largely due to releases like Monster Hunter 3G before the Quarter and Animal Crossing, now the best selling 3DS game in Japan. PSV sales have dropped over 70%, which is worrysome because PSV was only out for 3 weeks in 2011. DS sales have crashed and the system will likely be discontinued in Japan in 2013. PSP is selling moderatly well and still seeing exclusive releases in Japan to boost software.


What is with all the hate? Don't read GamrReview Articles. Contact me to ADD games to the Database
Vote for the March Most Wanted / February Results

Platform 2011 Annuals Sales 2012 Annual Sales % Difference
3DS 13.25 million 13.78 million +4%
PS3 14.12 million 11.89 million -15.8%
360 13.81 million 10.48 million -24.1%
Wii 11.57 million 5.13 million -55.7%
PSV 0.48 million 3.60 million +750%
DS 8.83 million 3.53 million -60%
PS2 4.10 million 2.92 million -28.8%
PSP 7.33 million 2.91 million -60.3%
WiiU N/A 2.45 million N/A

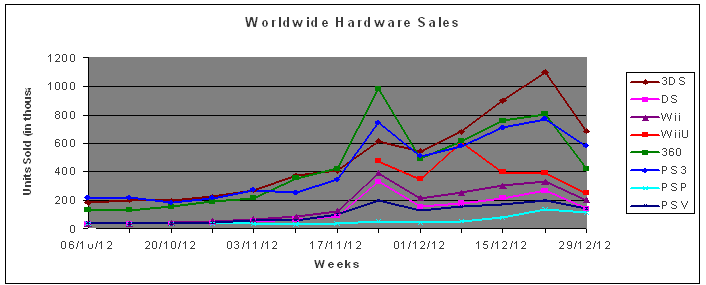
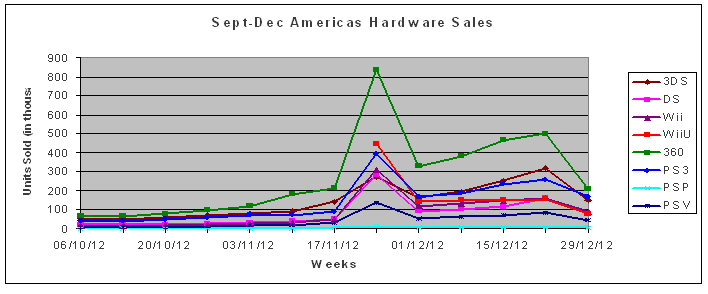
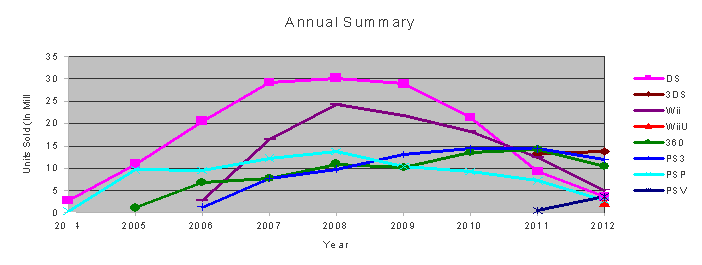
I don't know why I removed PS2 data from this graph, but oh well. PS3 has been outselling the 360 since 2009, and up to 2010 Nintendo owns. Nintendo will probably own in 2013 with WiiU and 3DS sales dominating.

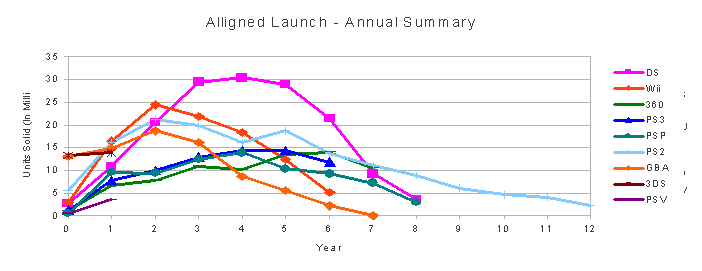
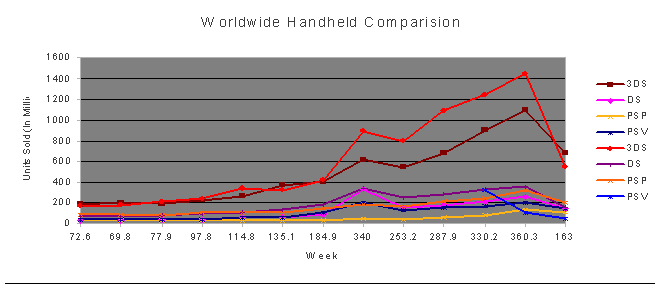
It's funny that the DS and PS2 have nearly identical lifetime sales with very different sales patterns. PS2 manged to sell 50 more units after it was replaced, while DS is struggling, selling less then 15 million after it's replacement. This is likely because of the high cost of importing consoles in South America, which faovrs Sony heavily, and Japan adandoning old consoles, which is a strong region for DS.

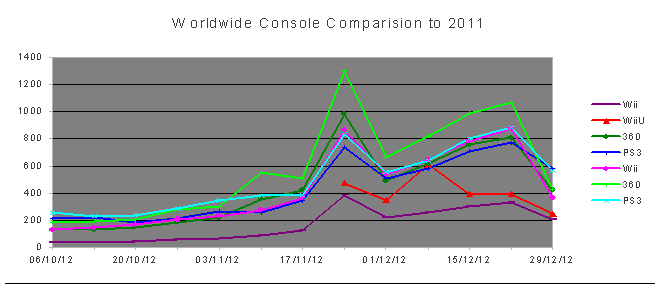
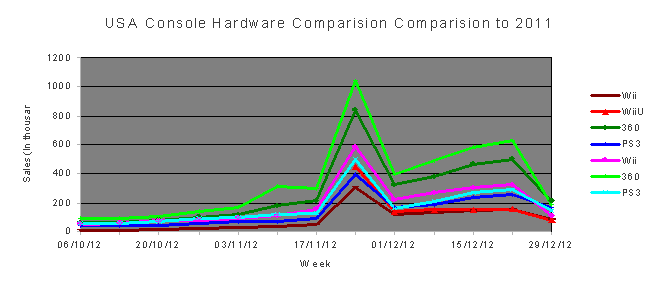
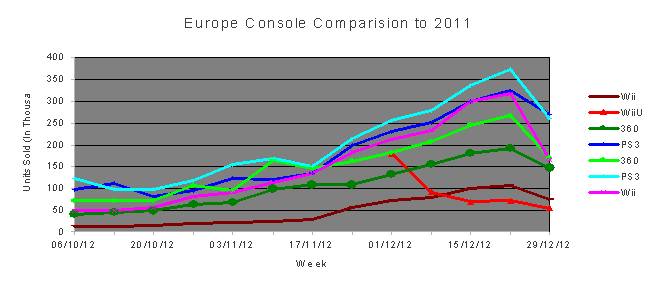
Comparing PS3 and 360 it's interesting to see that while PS3 has been outselling the 360 for the last 4 years, 360 has been outselling the PS3 for it's later years in it's alligned life. Chances are PS3 will not be able to keep up with the 360 for it's 7th and 8th year on the market. Many people used to argue PS3 was going to outsell the 360 fast because it's alligned sales were initially higher, so does this mean that PS3 sales will crash before it has a chance to surpass the 360? Or maybe PS3 sales will crash just after, leaving both consoles with similar lifetime sales. Anything can happen, Sony typically sell well after their console is replaced, but this is Microsofts first high volume console, so anything can happen.

If PS3/360 sales are to continue to follow PSP sales, chances are both system will stop selling at around 10 years, with year 9 and 10 being fairly weak years.

Wii needs a decent tail to surpass PS1 sales, if it follows DS's late life pattern, it might just do it, but if it follows GBA's pattern it probably won't.

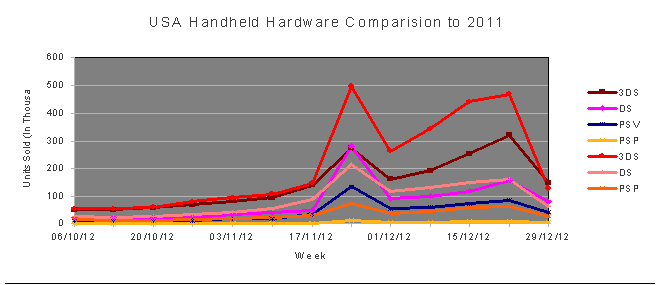
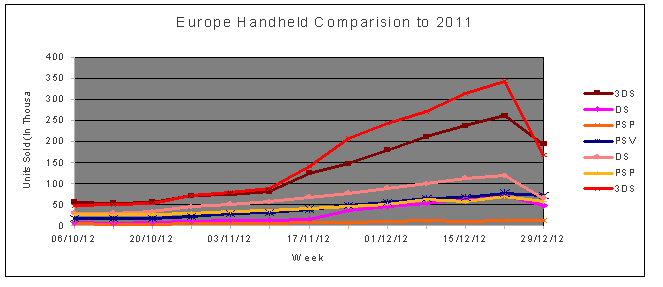
As for 3DS anything can happen. It's hard to compare 3DS to DS because of the $80 price cut it got in its first year, which lead to strong sales, but it should mimic DS sales and sell well over 100 million lifetime.

What to expect for 2013

PS3 and 360 sales are within 2 million units, however PS3 and 360 sales are expected to be significantly lower in 2013 then in 2012. Just like Wii sales crashed in 2012, expect PS3/360 sales to crash in 2013, especially after the announcement of next gen systems. PS3/360 sales probably won't fall by 50% or great like Wii's did because the next generation systems have still not been announced, but chances are fall 2013 sales will be hurt. This means that 2013 annual sales will likely range between 5-7 million units for the 360, and 7-9 units for the PS3. IF PS3 doesn't overtake 360 in 2013, it will come very close and overtake it in 2014.

PS3 and 360 should overtake PSP Worldwide in 2013. The 360 is only 1.5 million units behind the PSP, so it could overtake it as early as Q1 of 2013. PS3 will likely overtake the PSP in Q2/Q3 2013.

Wii is currently 5 million units behind PS1 in lifetime sales (3.5 if you use Sony and Wikipedia's numbers). If Nintendo releases the Wii Mini outside of Canada, Wii sales should still be strong in 2013, and it could sell as much as 4 million units. Still short of PS1 lifetime sales, but this will give Wii a chance to top PS1 in 2014. Without a decent push from Nintendo, the Wii may sell as little as 2 million units in 2013, and 2 million more in the years after, thus putting it just behind the PS1 in terms of lifetime sales. I doubt Nintendo wants this, but lets see what happens. Wii could pass PS1 sales in 2013 or 2014.

By Q4 2013, the 360 could pass GBA's lifetime sales of 81.51 million. PS3 will likely be very close to this point as well. If either or both systems do not surpass GBA in 2013, they will surpass GBA's lifetime sales in 2014.

360 should pass Wii's USA lifetime sales in 2013, but PS3 probably won't pass Wii lifetime sales in Europe until 2014. 360 only needs 1.91 millionmore sales then Wii in 2013 to pass Wii in USA. PS3 needs 4.07 million, which is possible, only if PS3 has a strong year in 2013, which it probably won't.

DS will continue to crawl closer and closer to PS2's lifetime sales. currently it is 2.5 million units behind the PS2, but it did outsell it by about 1.6 million units this year. With PS2 now discontinued in Japan, and sales increadibly slow in developed countries, PS2 sales will likely drop strongly next year. However DS sales could drop a bit as well. Anything could happen in this battle, but if DS surpasses PS2's lifetime sales, it probably won't happen in 2013. PS2 is still King baby.

3DS should pass N64, Atari 2600, and Sega Genesis lifetime sales in the first half of 2013, making the system the 12th best selling system of all time in only a little over 2 years.

PSV should pass Sega CD and Colecovision sales in 2013
, and with a bit of luck maybe even Sega Dreamcast and Sega Saturn sales. If not it will be in the 7-9 million ballpark, which is decent.

WiiU will outsell the PSV, probably within the first quarter of 2013. WiiU should also top a list of other semi successful systems including the Turbo Grafx, Sega Master System, Saturn, and Dreamcast. Expect WiiU sales to approach Gamecube and X-Box 1 lifetime sales by the end of 2013.

Best Selling Video Game Consoles

Note: Release Dates are for North America, the bolded values beside some consoles represent the number of units sold since the last update.

1 – 156.72 million - Sony Playstation 2 (October 26th, 2000) (Plus 0.54 million)
2 – 15
4.27 million - Nintendo DS (November 21st, 2004) (Plus 1.64 million)
3 – 118.69 million - Nintendo Gameboy and Gameboy Color (GB-August 1989, GBC-November 1998)

4 – 104.25 million - Sony Playstation (September 9th, 1995)
5 – 9
8.79 million - Nintendo Wii (November 19th, 2006) (Plus 2.13 million)
6 – 81.51 million - Nintendo Gameboy Advance (June 11th, 2001)
7 – 75.
77 million - Sony Playstation Portable (March 24th, 2005) (Plus 0.71 million)
8 –
74.25 million - Microsoft X-Box 360 (November 22nd, 2005) (Plus 5.67 million)
9 –
72.41 million - Sony Playstation 3 (November 11th 2006) (Plus 5.59 million)
10 – 61.91 million - Nintendo Entertainment System (US-October 18th, 1985, Can-February 1986)
11 – 49.10 million - Super Nintendo Entertainment System (August 13th 1991)
12 – 32.93 million - Nintendo 64 (September 29th, 1996)

13 – 30.00 million - Atari 2600 (October, 1977)
14 – 28.54 million - Sega Mega Drive/Genesis (August 14th, 1989)
15 – 27.03 million – Nintendo 3DS (March 27th, 2011) (Plus 6.38 million)
1
6 – 24.65 million - Microsoft X-Box (November 15th, 2001)
1
7 – 21.74 million - Nintendo Gamecube (November 18th, 2001)
18 – 13.00 million - Sega Master System (October 1986)
19 – 10.62 million - Sega GameGear (1991)
20 – 10.00 million - Nippon Electric Company TurboGrafx-16 (August 29th, 1989)
21 – 8.82 million - Sega Saturn (May 11th 1995)
22 – 8.20 million - Sega Dreamcast (September 9th, 1999)
23 – 6.00 million - Coleco ColecoVision (August 1982)

24 – 6.00 million - Sega CD (October 15th 1992)
25 –
4.09 million – Playstation Vita (February 15th, 2012) (Plus 1.37 million)
2
6 – 3.00 million - Mattel Intellivision (1980)
2
7 – 3.00 million - Nokia N-Gage (October 7th, 2003)
28 - 2.45 million - Nintendo WiiU (November 18th, 2012) NEW
29 – 2.00 million - Panasonic 3DO Interactive Multiplayer (September 1993)
29 – 2.00 million - SNK Neo-Geo Pocket, and Neo-Geo Pocket Colour (1998)

31 – 1.50 million - Nippon Electric Company TurboExpress (1990)
32 - 1.12 million – Namco Bandai WonderSwan (1999)

33 – 1.00 million - Sega Nomad (October 1995)
34 - 0.77 million - Nintendo Virtual Boy (August 14th 1995)
35 - 0.57 million - Phillips CDi (1991)
36 - 0.50 million - Atari Lynx (September 1989)
37 - 0.30 million - Tiger Electronics Game.com (September 1997)
38 - 0.25 million - Atari Jaguar (November 18th 1993)
39 - 0.20 million - Sega 32X (November 1994)
40 - 0.042 million - Apple Pippin (1995)
41 - 0.025 million - Tiger Telematics Gizmondo (March 19th 1995)
42 - 0.015 million - Nintendo 64 Disk Drive (December 1st 1999- Japan Only)


Current Generation Regional Console Sales

USA

152.34 million - Nintendo DS (Plus 1.04 million)
2 –
49.09 million – Sony PS2 (Plus 0.06 million)- 6th Gen
3 –
40.77 million - Nintendo Wii (Plus 1.13 million)
4 – 3
8.86 million - Xbox 360 (Plus 3.55 million)
5
23.89 million - Sony PS3 (Plus 1.84 million)
6 – 19.63 million - Sony PSP (Plus 0.06 million)
7 –
7.62 million – Nintendo 3DS (Plus 1.90 million) - 8th Gen
8 – 1.24 million – Sony PSV – (Plus 0.56 million) - 8th Gen
9 – 1.09 million – Nintendo WiiU – NEW - 8th Gen


Europe

1 – 54.05 million – Sony PS2 (Plus 0.14 million) - 6th Gen
2 – 51.
97 million - Nintendo DS (Plus 0.40 million)
3 – 3
2.52 million - Nintendo Wii (Plus 0.62 million)
4 – 2
8.45 million - Sony PS3 (Plus 2.34 million)
6 – 2
3.03 million - Xbox 360 (Plus 1.38 million)
5 – 21.
65 million - Sony PSP (Plus 0.10 million)
7 –
7.19 million – Nintendo 3DS (Plus 1.76 million) - 8th Gen
8 – 1.35 million – Sony PSV – (Plus 0.57 million) - 8th Gen
9 – 0.47 million – Nintendo WiiU – NEW - 8th Gen


Japan

1 – 33.01 million - Nintendo DS (Plus 0.01 million)
2 – 21.8
3 million – Sony PS2 (Plus 0.01 million) - 6th Gen
3 – 19.
48 million - Sony PSP (Plus 0.26 million)
4 – 12.6
8 million - Nintendo Wii (Plus 0.08 million)
69.82 million – Nintendo 3DS (Plus 2.27 million) - 8th Gen
5 – 8.
90 million - Sony PS3 (Plus 0.41 million)
7 - 1.6
5 million - Xbox 360 (Plus 0.03 million)
8 –
1.11 million – Sony PSV (Plus 0.13 million) - 8th Gen
9 – 0.64 million – Nintendo WiiU – NEW - 8th Gen

My Math for PS2 sales

VGC has PS2 sales at 153.68 million as of 2011 end, with 2.25 million units sold in that year. Sony claims 154.5 million units shipped by this point, with 4.7 million shipped in that year. So this puts approximately 720k units on shelves. Since FYQ3 2011, Sony has been shipping less then 50% of PS2 systems from the prior year, so far all simple estimation purposes, I will assume for Quarters not given that PS2 shipments are 60% of what they were in 2011 (So I'm being optimistic). Also I'm going to assume Sony sells everything they ship except for 1/3
rd the previous years shipment. (which would put PS2 at 700k units sold less then shipped as VGC had it).

Sony claims 0.6 million units shipped in Q1 of this year (Q4FY 2011). 60% of Q1/Q2 FY 2011 sales (April 1st-Sept 31st) give PS2 0.7 and 0.6 million units shipped respectively, and assuming everything is sold except for 1/3rd the last shipment. This would put PS2 at 0.6 million shipped for Q1, 0.84 million shipped for Q2, 0.72 million shipped for Q3, and 0.54 million shipped for Q4.

This would give Sony 0.94 million units sold for Q1, 0.78 million units for Q2, 0.78 million units for Q3 and 0.54 million for Q4. This leaves a gap between units shipped and sold of 0.38 million for Q3 and 0.20 million for Q4. This puts PS2 sales at 2.94 million sold for the end of 2012.

So 2.94 million sold for 2.70 million shipped, yes it is selling more then it shipped, but it's shipping significantly less then it used to and....well PS2 should phase out soon. It has in Japan just recently, I'm sure USA and Europe will follow suit soon too. Pretty amazing for a 12 year old console to be holding off DS from the crown.

Now this means that PS2 will be selling 0.63 million better then in 2011 if we use VGC's PS2 sales data (selling 2.25 million in 2011), but when you look at how much PS2 has been shipping in the last 3 years, if we trusted VGC data, PS2 sales should be 5 million behind the shipped value, but even VGC's own PS2 total isn't that far off. Clearly VGC can't track PS2, and that's why they stopped sharing PS2 data (although they still give PS2 software sales in Japan).

For regional sales, I am going to assume 60% of PS2 sales are in the Middle East, South America, Africa, Canada, etc. I'm going to assume 25% of PS2 sales are from Europe, and 12.5% are from the US. About 2.5% are attributed by Japan (Media Create). So if this quarter PS2 sold 0.78 million, this means that 0.195 million sales are gained in Europe, and 0.0975 sales are gained in USA. I estimate that PS2 sales in USA are 48.72 at end of 2011 (53.65 million sales in North America x (10/11) since Mexico sales are minor, and Canada is 1/10th the US population)

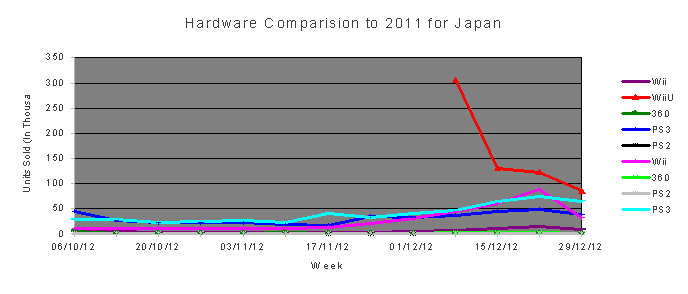
PS2 hardware sales data in Japan is obtained using Media Create information, while software sales data is supplied by VGC.

P.S. 2.94 million sales for 2012 is quite high for PS2. It's more then the WiiU for the year, and a hair better then PSP. Ds will have to fight for the title best selling system if PS2 keeps this up. PS2 does not get a large boost in sales in Q4 like most consoles, and it's sales are fairly evenly spread during the year. Still impressive though.


What is with all the hate? Don't read GamrReview Articles. Contact me to ADD games to the Database
Vote for the March Most Wanted / February Results

Around the Network

reserved because the others are being reserved and i'm no leader. i follow the crowd lol.

great job and great comparison/tracking.

you think Sony will have sold 1m for the month of Jan.?


MARCUSDJACKSON said:

reserved because the others are being reserved and i'm no leader. i follow the crowd lol.

great job and great comparison/tracking.

you think Sony will have sold 1m for the month of Jan.?

Sony to sell 1 million what? PS3's PSV's PSP's? January and Q1 sales are generally pretty stong because all the christmas hype is still boosting console sales, and Sony has God of War coming out too.

I don't have my Q1 2011 data on me, but Sony should still be able to sell over 2 million PS3's for Q1, and maybe 1 million for the month of January alone. Maybe. It will be close.


What is with all the hate? Don't read GamrReview Articles. Contact me to ADD games to the Database
Vote for the March Most Wanted / February Results

Michael-5 said:
MARCUSDJACKSON said:

reserved because the others are being reserved and i'm no leader. i follow the crowd lol.

great job and great comparison/tracking.

you think Sony will have sold 1m for the month of Jan.?

Sony to sell 1 million what? PS3's PSV's PSP's? January and Q1 sales are generally pretty stong because all the christmas hype is still boosting console sales, and Sony has God of War coming out too.

I don't have my Q1 2011 data on me, but Sony should still be able to sell over 2 million PS3's for Q1, and maybe 1 million for the month of January alone. Maybe. It will be close.

i never factor PSP or Vita into my thoughts on sales so PS3. i think 800k-1m. ops i factored in Dec wk 29 lol. i'm not so sure now lol. i know Sony mormaly dominates Jan. for 2 wks's then does about 50k more then 360 for the rest of the month.


a better question is will Sony sell through 70m to cut the 360 lead by 1m. they shipped about the same amount.

i'd say 500k-1.5m difference in shipped numbers.


MARCUSDJACKSON said:

i never factor PSP or Vita into my thoughts on sales so PS3. i think 800k-1m. ops i factored in Dec wk 29 lol. i'm not so sure now lol. i know Sony mormaly dominates Jan. for 2 wks's then does about 50k more then 360 for the rest of the month.

Well in 3 months, you'll have to see my Q1 special then. lol. My Annual Summary post will be interesting as it compares trends in sales for PS3 and 360, and I talk about what to expect for 2013.


What is with all the hate? Don't read GamrReview Articles. Contact me to ADD games to the Database
Vote for the March Most Wanted / February Results