By using this site, you agree to our Privacy Policy and our Terms of Use. Close

Forums - Sales - June 2025 VGChartz Estimates Thread - Adding Switch 2 - Worldwide Estimates Now Live

Updated worldwide breakdown article following NS2, NS1, PS5, Xbox Series X|S adjustments:

Switch 2 Sets Record With Over 5M Sold in 1st Month - Worldwide Hardware Estimates for June 2025

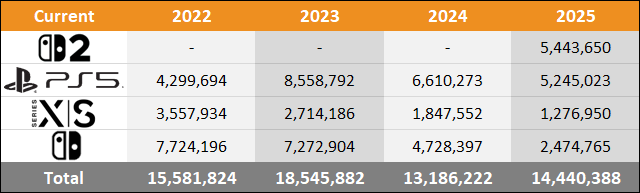
The Nintendo Switch 2 was the best-selling console worldwide with 5,443,650 units sold for June 2025, according to VGChartz estimates.

This is easily the biggest hardware launch in video game history. The previous biggest launch month was set by the PS5 with an estimated 2.76 million units sold in November 2020. It should be noted the first month for the PS5 was three weeks, while it was five weeks for the Switch 2. The PS5 sold 4.37 million units by the end of December 2020 (eight weeks) and the PS4 sold 4.45 million units by the end of December 2013 (eight weeks).

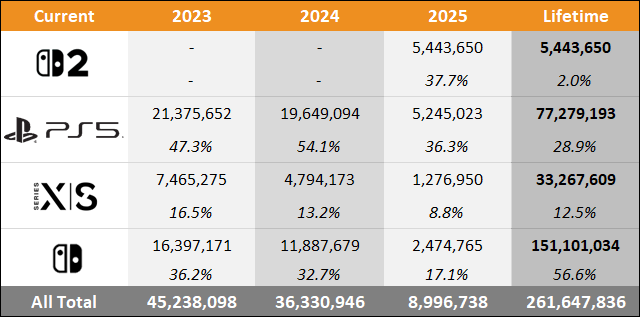
The PlayStation 5 was the second best-selling console with an estimated 931,703 units sold to bring lifetime sales to 77.28 million units. The Nintendo Switch 1 was the third best-selling console with an estimated 322,850 units sold to bring lifetime sales to 151.10 million units. The Xbox Series X|S came in fourth place with 144,706 units sold to bring its lifetime sales to 33.27 million units.

Switch 2 sales compared to the first month for Switch 1 in 2017 are up by 3.11 million units, as the Switch 1 sold 2.33 million units in its first month worldwide in March 2017.

PS5 sales compared to the same month for the PS4 in 2018 are down by nearly 235,000 units, while the Xbox Series X|S compared to the same month for the Xbox One are down by nearly 357,000 units. PS4 sold 1,166,203 units for the month of June 2018 and Xbox One sales were at 501,216 units.

PlayStation 5 sales compared to the same month a year ago are down by 144,512 (-13.4%). Xbox Series X|S sales are down by 164,456 units (-53.2%) and Nintendo Switch 1 sales are down by 443,223 units (-57.9%).

Looking at sales month-on-month, PlayStation 5 sales are up by over 171,000 units, Xbox Series X|S sales are up by over 5,000 units, and Nintendo Switch 1 sales are down by nearly 15,000.

2025 year-to-date, the PlayStation 5 has sold an estimated 5.25 million units, the Nintendo Switch 2 has sold 5.01 million units, the Nintendo Switch 1 has sold 2.47 million units, and the Xbox Series X|S has sold 1.28 million units.

Monthly Sales:

Global hardware estimates for June 2025 (Followed by lifetime sales):

  1. Switch 2 - 5,443,650 (NEW)
  2. PlayStation 5 - 931,703 (77,279,193)
  3. Switch 1 - 322,850 (151,101,034)
  4. Xbox Series X|S - 144,706 (33,267,609)
Americas (US, Canada, Latin America) hardware estimates for June 2025:
  1. Switch 2 - 1,921,075
  2. PlayStation 5 - 348,729
  3. Switch 1 - 117,050
  4. Xbox Series X|S - 83,524
Europe hardware estimates for June 2025:
  1. Switch 2 - 1,156,638
  2. PlayStation 5 - 315,982
  3. Switch 1 - 66,835
  4. Xbox Series X|S - 43,782
Asia (Japan, mainland Asia, Middle East) hardware estimates for June 2025:
  1. Switch 2 - 2,207,080
  2. PlayStation 5 - 224,066
  3. Switch 1 - 128,686
  4. Xbox Series X|S - 7,898
Oceania (Australia and New Zealand) hardware estimates for June 2025:
  1. Switch 2 - 158,857
  2. PlayStation 5 - 42,926
  3. Switch 1 - 10,279
  4. Xbox Series X|S - 9,502

Weekly Sales:

Global June 7, 2025 hardware estimates:

  1. Switch 2 - 3,704,173
  2. PlayStation 5 - 219,274
  3. Switch 1 - 66,775
  4. Xbox Series X|S - 28,819

Global June 14, 2025 hardware estimates:

  1. Switch 2 - 467,260
  2. PlayStation 5 - 193,751
  3. Switch 1 - 61,240
  4. Xbox Series X|S - 28,494

Global June 21, 2025 hardware estimates:

  1. Switch 2 - 378,065
  2. PlayStation 5 - 171,881
  3. Switch 1 - 62,086
  4. Xbox Series X|S - 28,577

Global June 28, 2025 hardware estimates:

  1. Switch 2 - 494,572
  2. PlayStation 5 - 171,825
  3. Switch 1 - 65,453
  4. Xbox Series X|S - 29,396

Global July 5, 2025 hardware estimates:

  1. Switch 2 - 399,580
  2. PlayStation 5 - 174,972
  3. Switch 1 - 67,296
  4. Xbox Series X|S - 29,420
Last edited by trunkswd - on 01 August 2025

VGChartz Sales Analyst and Writer - William D'Angelo - I stream on Twitch and have my own YouTube channel discussing gaming sales and news. Follow me on Bluesky.

I post and adjust the VGChartz hardware estimates, with help from Machina.

Writer of the Sales Comparison | Monthly Hardware Breakdown Monthly Sales Analysis | Marketshare Features, as well as daily news on the Video Game Industry.

Around the Network

Updated the Japan articles due to the Nintendo earnings report. NS2 is now more inline with Famitsu figures. 

Switch 2 Smashes Records in Japan - Japan Hardware Estimates for June 2025

2025 Japan Sales Comparison Charts Through June - Switch 2 vs PS5 vs Xbox Series X|S vs Switch


VGChartz Sales Analyst and Writer - William D'Angelo - I stream on Twitch and have my own YouTube channel discussing gaming sales and news. Follow me on Bluesky.

I post and adjust the VGChartz hardware estimates, with help from Machina.

Writer of the Sales Comparison | Monthly Hardware Breakdown Monthly Sales Analysis | Marketshare Features, as well as daily news on the Video Game Industry.

Jul: 17
Aug: -38
Sep: -55
Oct: -23
Nov: -25
Dec: -47
Jan: -49
Feb: -21
Mar: -20
Apr: -2
May: -39
Jun: -53

These are the year-on-year percentages of X|S hardware sales estimates, of their now closed fiscal year.

Which results in an average of -29.58% year-on-year in hardware.

That's an interesting and pretty close deviation from their official -22% number.

With many, at least 4, possible reasons behind it.


Panicradio said:

Jul: 17
Aug: -38
Sep: -55
Oct: -23
Nov: -25
Dec: -47
Jan: -49
Feb: -21
Mar: -20
Apr: -2
May: -39
Jun: -53

These are the year-on-year percentages of X|S hardware sales estimates, of their now closed fiscal year.

Which results in an average of -29.58% year-on-year in hardware.

That's an interesting and pretty close deviation from their official -22% number.

With many, at least 4, possible reasons behind it.

The price increase is the reason for why units sold are down more than the drop in revenue. 


VGChartz Sales Analyst and Writer - William D'Angelo - I stream on Twitch and have my own YouTube channel discussing gaming sales and news. Follow me on Bluesky.

I post and adjust the VGChartz hardware estimates, with help from Machina.

Writer of the Sales Comparison | Monthly Hardware Breakdown Monthly Sales Analysis | Marketshare Features, as well as daily news on the Video Game Industry.

Link to the VGChartz article here.

2025 Worldwide Sales Comparison Charts Through June - Switch 2 vs PS5 vs Xbox Series X|S vs Switch

Here we see data representing the sales through to consumers and change in sales performance of the four current platforms (Nintendo Switch 2, PlayStation 5, Xbox Series X|S, and Nintendo Switch 1) over comparable periods for 2022, 2023, 2024, and 2025. Also shown is the market share for each of the consoles over the same periods.

Year to Date Sales Comparison (Same Periods Covered)

Market Share (Same Periods Covered)

2021 – (January 2022 to June 2022)

2022 – (January 2023 to June 2023)

2023 – (January 2024 to June 2024)

2024 – (January 2025 to June 2025)

"Year to date" sales for 2022, 2023, 2024, and 2025 sales are shown in series at the top of the table and then just below a comparison of 2025 versus 2024 and 2025 versus 2023 is displayed.  This provides an easy-to-view summary of all the data.

Total Sales and Market Share for Each Year

Nintendo

  • Nintendo Switch 2
    • 5.44 million units sold year-to-date
  • Nintendo Switch 1
    • 2.47 million units sold year-to-date
    • Down year-on-year 2.25 million units (-47.7%)

Sony

  • PlayStation 5
    • 5.25 million units sold year-to-date
    • Down year-on-year 1.37 million units (-20.7%)

Microsoft

  • Xbox Series X|S
    • 1.28 million units sold year-to-date
    • Down year-on-year 0.57 million units (-30.9%)

Note: VGChartz 2025, 2023, and 2022 estimates through June includes 26 weeks, while 2024 estimates includes 27 weeks.


VGChartz Sales Analyst and Writer - William D'Angelo - I stream on Twitch and have my own YouTube channel discussing gaming sales and news. Follow me on Bluesky.

I post and adjust the VGChartz hardware estimates, with help from Machina.

Writer of the Sales Comparison | Monthly Hardware Breakdown Monthly Sales Analysis | Marketshare Features, as well as daily news on the Video Game Industry.

Around the Network
trunkswd said:
Panicradio said:

Jul: 17
Aug: -38
Sep: -55
Oct: -23
Nov: -25
Dec: -47
Jan: -49
Feb: -21
Mar: -20
Apr: -2
May: -39
Jun: -53

These are the year-on-year percentages of X|S hardware sales estimates, of their now closed fiscal year.

Which results in an average of -29.58% year-on-year in hardware.

That's an interesting and pretty close deviation from their official -22% number.

With many, at least 4, possible reasons behind it.

The price increase is the reason for why units sold are down more than the drop in revenue. 

Do you really think the price increase from back in May (May, June for full fiscal year) attributed to a 7.58% deviation in only two months?

I personally don't think so.

But this is no criticsm towards your estimates anyway, since Microsoft's data (or rather; not shared data) reeeally must be pain in the ... you know what.

Furhermore, it was leaked a while ago that Xbox "hardware revenue" obviously includes revenue from even Accessoires such as controllers, headsets, etc.

https://www.installbaseforum.com/threads/xbox-contents-and-services-hardware-revenue-2014-present-update-as-of-august-9-2024.108/?utm_source=chatgpt.com

I still believe X|S are more likely overtracked than undertracked, but this appearantly is only my claim (backing up other claims/rumors).

Nonetheless, you're doing absolutely great and I appreciate your continued support of data!