


Link to the VGChartz article here.
PS5 vs Xbox Series X|S vs Switch 2024 Americas Sales Comparison Charts Through October
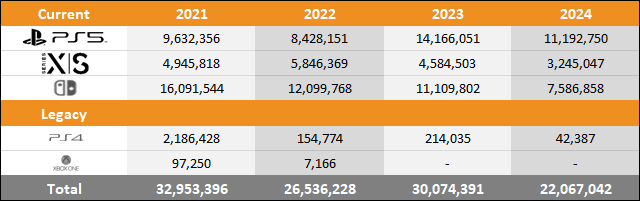
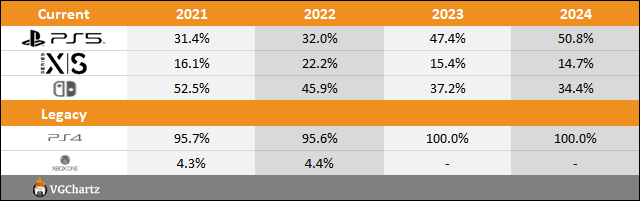
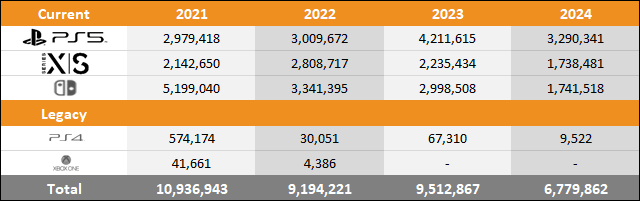
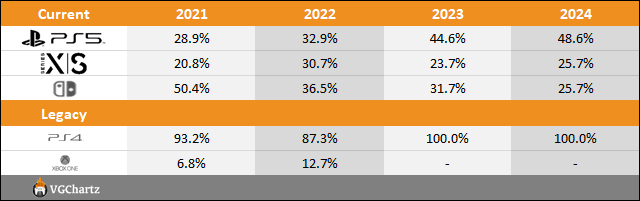
Here we see data representing the sales through to consumers and change in sales performance of the three current platforms (PlayStation 5, Xbox Series X|S, and Nintendo Switch) and two legacy platforms (PlayStation 4 and Xbox One) over comparable periods for 2021, 2022, 2023, and 2024. Also shown is the market share for each of the consoles over the same periods.
Year to Date Sales Comparison (Same Periods Covered)
Market Share (Same Periods Covered)
2021 – (January 2021 to October 2021)
2022 – (January 2022 to October 2022)
2023 – (January 2023 to October 2023)
2024 – (January 2024 to October 2024)
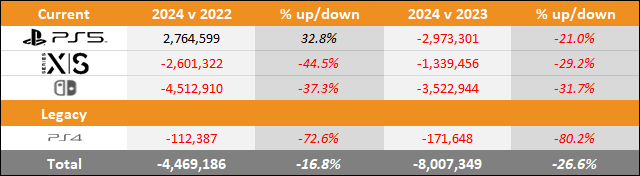
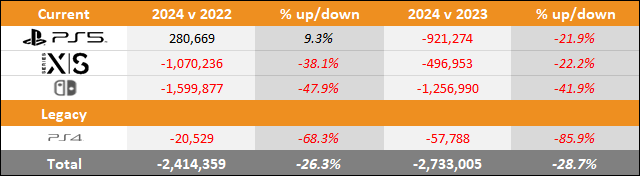
"Year to date" sales for 2021, 2022, 2023, and 2024 sales are shown in series at the top of the table and then just below a comparison of 2024 versus 2023 and 2024 versus 2022 is displayed. This provides an easy-to-view summary of all the data.
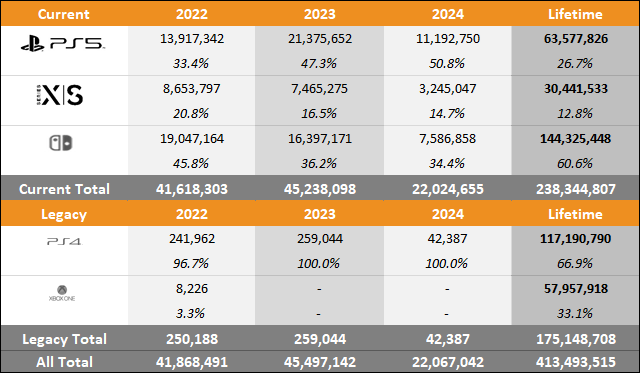
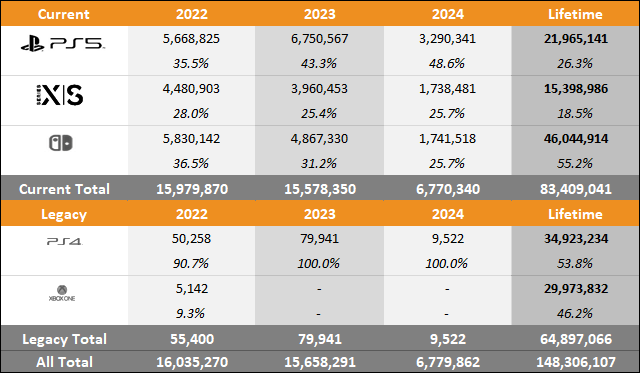
Total Sales and Market Share for Each Year
Microsoft
- Xbox Series X|S
- 1.74 million units sold year-to-date
- Down year-on-year 0.50 million units (-22.2%)
Nintendo
- Nintendo Switch
- 1.74 million units sold year-to-date
- Down year-on-year 1.26 million units (-41.9%)
Sony
- PlayStation 5
- 3.29 million units sold year-to-date
- Down year-on-year 0.92 million units (-21.9%)
- PlayStation 4
- 0.01 million units sold year-to-date
- Down year-on-year 0.06 million (-85.9%)
Note: VGChartz 2024 estimates through October includes 44 weeks, while 2023, 2022, and 2021 estimates includes 43 weeks.
VGChartz Sales Analyst and Writer - William D'Angelo - I stream on Twitch and have my own YouTube channel discussing gaming sales and news. Follow me on Bluesky.
I post and adjust the VGChartz hardware estimates, with help from Machina.
Writer of the Sales Comparison | Monthly Hardware Breakdown | Monthly Sales Analysis | Marketshare Features, as well as daily news on the Video Game Industry.