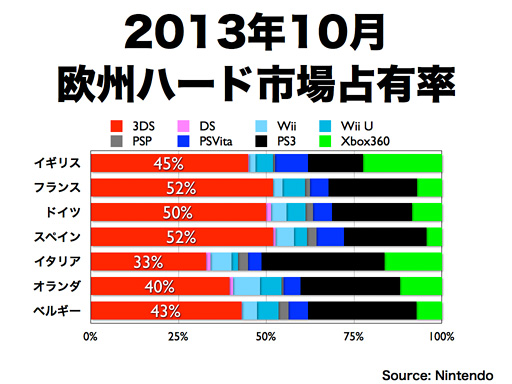
Train wreck on 31 October 2013
From Neogaf:
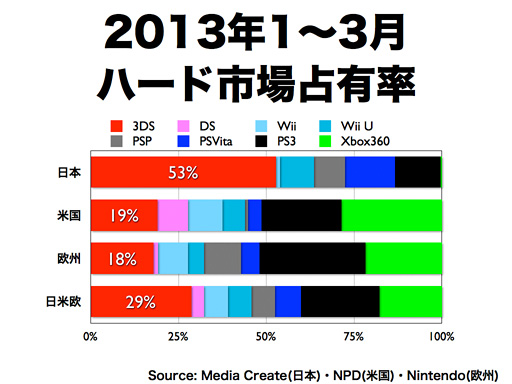
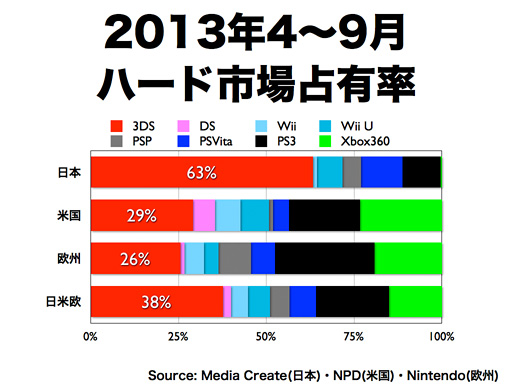
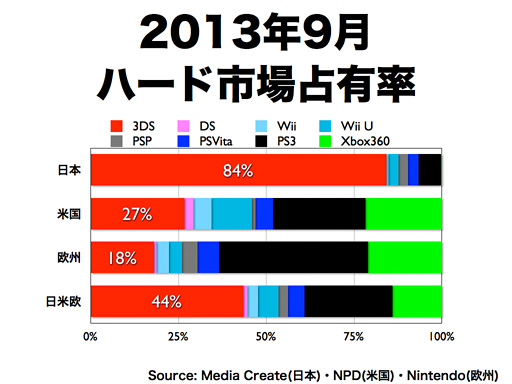
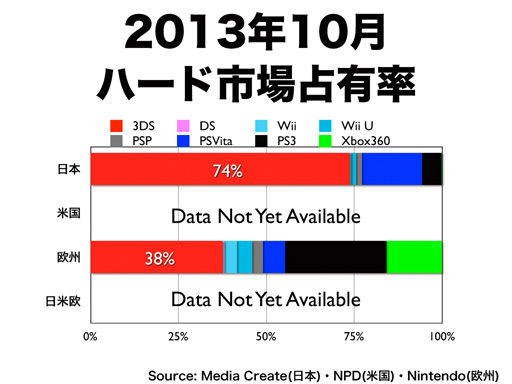
1) JAPAN
2) US
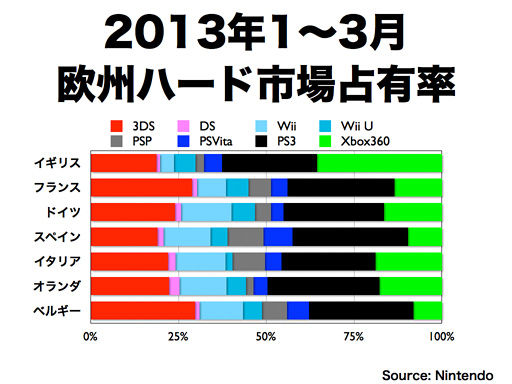
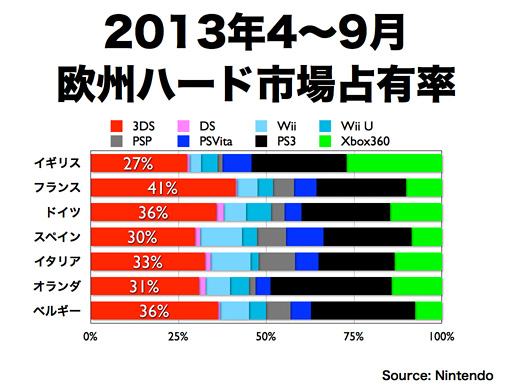
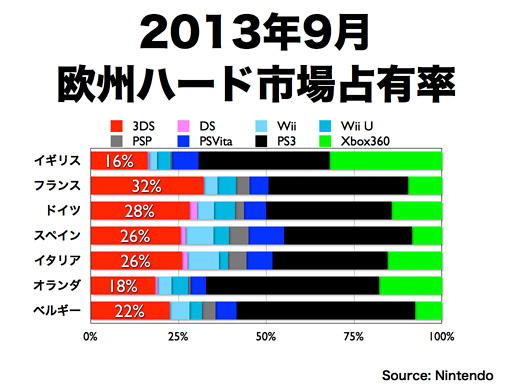
3) EUROPE
4) TOTAL
1) UK
2) FRANCE
3) GERMANY
4) SPAIN
5) ITALY
6) NETHERLANDS
7) BELGIUM