
BBH on 06 July 2010
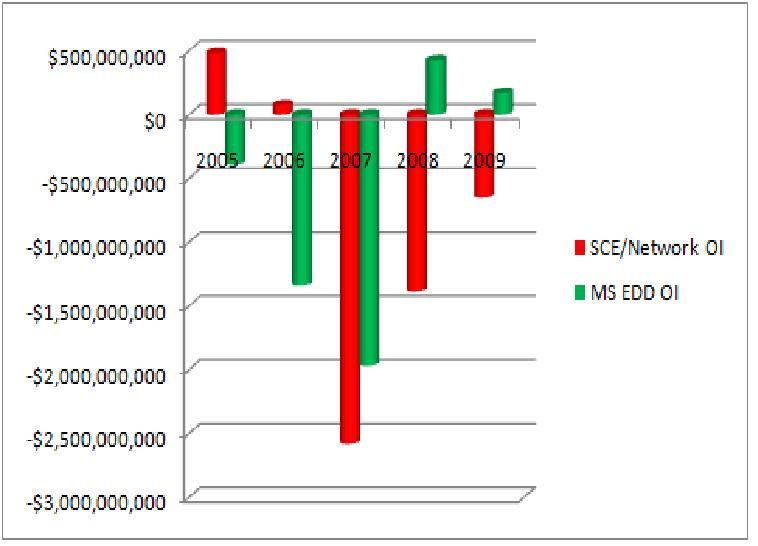
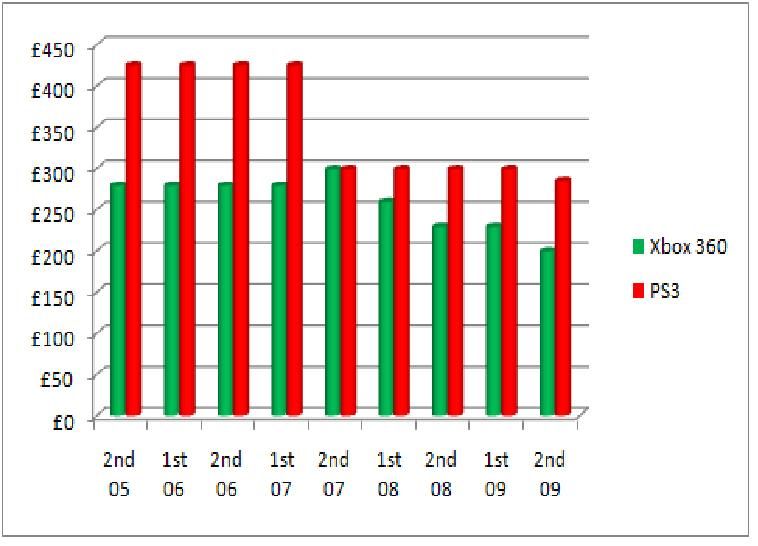
Xbox 360 in green. PS3 in red. Units of sales/finance on the left.
Financials
Sales
2005
2006
2007
2008
2009


Xbox 360 in green. PS3 in red. Units of sales/finance on the left.
2005
2006
2007
2008
2009
| Year/Months | PS3 Sales | 360 Sales | SCE/Network OI | MS EDD OI |
| 2005 | $480,000,000 | ($391,000,000) | ||
| Jan & Feb | N/A | N/A | ||
| Mar & Apr | N/A | N/A | ||
| May & June | N/A | N/A | ||
| July & Aug | N/A | N/A | ||
| Sept & Oct | N/A | N/A | ||
| Nov & Dec | N/A | 1,173,809 | ||
| 2006 | $74,000,000 | ($1,339,000,000) | ||
| Jan & Feb | N/A | 838,254 | ||
| Mar & Apr | N/A | 873,150 | ||
| May & June | N/A | 787,686 | ||
| July & Aug | N/A | 684,447 | ||
| Sept & Oct | N/A | 701,841 | ||
| Nov & Dec | 1,232,194 | 2,870,085 | ||
| 2007 | ($2,581,388,889) | ($1,969,000,000) | ||
| Jan & Feb | 690,361 | 1,031,092 | ||
| Mar & Apr | 1,237,249 | 654,381 | ||
| May & June | 573,045 | 708,508 | ||
| July & Aug | 849,598 | 827,935 | ||
| Sept & Oct | 1,036,032 | 1,636,538 | ||
| Nov & Dec | 3,235,606 | 3,019,891 | ||
| 2008 | ($1,383,622,222) | $426,000,000 | ||
| Jan & Feb | 1,559,046 | 1,170,829 | ||
| Mar & Apr | 1,358,734 | 1,151,993 | ||
| May & June | 1,236,458 | 938,078 | ||
| July & Aug | 1,118,247 | 1,046,272 | ||
| Sept & Oct | 1,202,100 | 1,607,562 | ||
| Nov & Dec | 3,244,880 | 5,093,919 | ||
| 2009 | ($649,733,333) | $169,000,000 | ||
| Jan & Feb | 1,268,611 | 1,474,252 | ||
| Mar & Apr | 1,239,598 | 1,223,416 | ||
| May & June | 895,998 | 945,205 | ||
| July & Aug | 1,393,845 | 1,013,884 | ||
| Sept & Oct | 2,125,197 | 1,201,387 | ||
| Nov & Dec | 5,581,020 | 4,371,058 | ||
| 2010 | ($923,222,322) | N/A | ||
| Jan & Feb | 1,844,374 | 1,441,955 | ||
| Mar & Apr | 1,689,812 | 1,179,612 | ||
| May & Jun | 1,060,237 | 977,010 | ||
| July & Aug | N/A | N/A | ||
| Sept & Oct | N/A | N/A | ||
| Nov & Dec | N/A | N/A |
To show in basic terms how prices have changed in the generation, with help of BHR-3's thread http://gamrconnect.vgchartz.com/thread.php?id=55397&page=1#
There are four graphs showing both the prices of entry models and top range models across the years in both the USA and the UK (whidh can be converted to EU prices). '1st 07' for example signifies the first half of year 2007.
Top Range Models
USA
UK
Cheapest Models
USA
UK

I'm curious as to where you're getting the financial side of this chart. Are you doing the math yourself or getting the numbers from somewhere else?

you should do a longer period comparision as R&D for PS3 and 360 was done before 2005 or during

| Solid_Snake4RD said: you should do a longer period comparision as R&D for PS3 and 360 was done before 2005 or during |
This looks like a 7th gen of consoles comparison which is just fine.
We all know who won the last gen in sales and profits.
disolitude said:
We all know who won the last gen in sales and profits. |
I WAS TALKING ABOUT THEIR R&D fianances


Where's Nintendo?

| jarrod said: Where's Nintendo? |
Off the chart.
Nov 2016 - NES outsells PS1 (JP)
Don't Play Stationary 4 ever. Switch!
About Us |
Terms of Use |
Privacy Policy |
Advertise |
Staff |
Contact
Display As Desktop
Display As Mobile
© 2006-2026 VGChartz Ltd. All rights reserved.