


| Barkley said: Most people on this site keep stating that the WiiU is profitable for Nintendo even with it's poor performance, however Nintendo has throughout this generation so far actually LOST money overall. People have used it as a primary reason as to why Nintendo shouldn't leave the hardware business, stating that it is still profitable even when performing badly. However if the 3ds cannot cover the damage done by the WiiU then this is clear not the case. Unless they far exceed projections for this coming fiscal year Nintendo will end the generation with a net loss. Hopefully the NX can turn the situation around and return to Nintendo overall making a profit on their platforms. What do you believe has caused the losses so far this generation? Is the 3ds turning a good profit but it still can't offset the damage done by the WiiU? Are the WiiU losses not THAT bad, but the 3ds isn't profiting as much as it seems? Or is Nintendo losing money in other areas not related to their dedicated hardware? I had not realised this at all, thanks to ZhugeEX for the image from his twitter.
FY 2011/2012 OPERATING LOSS: $459.54 Million
FY 2012/2013 OPERATING LOSS: $366 Million
FY 2013/2014 OPERATING LOSS: $456 Million
FY 2014/2015 OPERATING PROFIT: $207.83 Million
FY 2015/2016 OPERATING PROFIT: $148.5 Million
FY 2011-2016 OPERATING LOSS: $925.21 Million (these figures don't seem to PRECISELY line up with the graph, potentially due to changes in the YEN's Value? If these figures are inaccurate if someone could find more accurate figures that would be appreciated.)
|

Sorry but you wrong, bottom of line is profit not operating income.
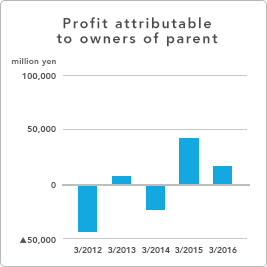
| FY3/2012 | FY3/2013 | FY3/2014 | FY3/2015 | FY3/2016 | |
|---|---|---|---|---|---|
| Net sales | 647,652 | 635,422 | 571,726 | 549,780 | 504,459 |
| Operating income | -37,320 | -36,410 | -46,425 | 24,770 | 32,881 |
| Ordinary income | -60,863 | 10,482 | 6,086 | 70,530 | 28,790 |
| Profit attributable to owners of parent | -43,204 | 7,099 | -23,222 | 41,843 | 16,505 |
| Net income per share (yen) | -337.86 | 55.52 | -183.59 | 353.49 | 137.40 |
| Total assets | 1,368,401 | 1,447,878 | 1,306,410 | 1,352,944 | 1,296,902 |
| Total net assets | 1,191,025 | 1,227,520 | 1,118,438 | 1,167,556 | 1,160,901 |
| Capital adequacy ratio | 87.0% | 84.8% | 85.6% | 86.3% | 89.5% |
| Net assets per share (yen) | 9,313.15 | 9,598.22 | 9,447.00 | 9,862.52 | 9,662.73 |
https://www.nintendo.co.jp/ir/en/finance/2015_04.html