


Yakuzaice said:
I don't know why people keep using this image. For one, it is using Operating Income for Sony and Microsoft, but Net Income for Nintendo. It hasn't been updated in years. That 2012 Sony number is from when they briefly rolled in things like TVs and PCs into a "Consumer Products & Services" division. The next year they broke "Game" back out and it showed a 29.3 billion yen profit for 2012 rather than the 229.8 billion yen loss. So, no, the PS brand isn't in the red. |
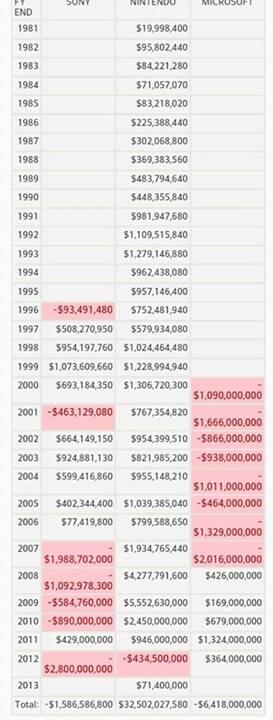
Here is a more up to date list of the numbers taken straight from Sony for the last ten years. I don't think the Fiscal Years are aligned properly on that above image chart for Sony (i.e. the 2011 number should be in the the 2010 place and so on), so that could be adding to the confusion. All numbers I took are for the Game divsion alone except for FY 2009 & FY 2010 where the NPS division (Networked Products and Services) includes PC and Other Networked businesses.
The sales and operating revenue for FY 2009 in the NPS division is split ~56% Game VS ~44% PC and Other Networked businesses.
The sales and operating revenue for FY 2010 in the NPS division is split ~53% Game VS ~47% PC and Other Networked businesses.
Sony's Gaming Division, Operating Income over the last 10 years:
Sony's Game Division, FY 2004 (April 2004 - March 2005)
729.8 billion JPY in sales
+43.2 billion JPY in operating income (+$404 million)
Sony's Game Division, FY 2005 (April 2005 - March 2006)
958.6 billion JPY in sales
+8.7 billion JPY in operating income (+$75 million)
Sony's Game Division, FY 2006 (April 2006 - March 2007)
1,016.8 billion JPY in sales
-232.3 billion JPY in operating income (-$1969 million)
Sony's Game Division, FY 2007 (April 2007 - March 2008)
1,284.2 billion JPY in sales
-124.5 billion JPY in operating income (-$1245 million)
Sony's Game Division, FY 2008 (April 2008 - March 2009)
1,053.1 billion JPY in sales
-58.5 billion JPY in operating income (-$597 million)
Sony's NPS Division (includes PlayStation), FY 2009 (April 2009 - March 2010)
1,575.8 billion JPY in sales
-83.1 billion JPY in operating income (-$893 million)
Sony's NPS Division (includes PlayStation), FY 2010 (April 2010 - March 2011)
1,579.3 billion JPY in sales
+35.6 billion JPY in operating income (+$429 million)
Sony's Game Division, FY 2011 (April 2011 - March 2012)
805.0 billion JPY in sales
+29.3 billion JPY in operating income (+$269.5 million)
Sony's Game Division, FY 2012 (April 2012 - March 2013)
707.1 billion JPY in sales
+1.7 billion JPY in operating income (+$15.6 million)
Sony's Game Division, FY 2013 (April 2013 - March 2014)
979.2 billion JPY in sales
-8.1 billion JPY in operating income (-$74.5 million)
+$404 million
+$75 million
-$1969 million
-$1245 million
-$597 million
-$893 million (includes non-PlayStation segments)
+$429 milion (includes non-PlayStation segments)
+$269.5 million
+$15.6 million
-$74.5 million
= -$3,585.4 million USD operating loss over the past 10 years