


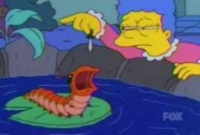

Screamapillar on 20 January 2013
thranx said:
|
The one about stricter gun laws, the blue bar graph. It's a silly graph.

The Screamapillar is easily identified by its constant screaming—it even screams in its sleep. The Screamapillar is the favorite food of everything, is sexually attracted to fire, and needs constant reassurance or it will die.
