


I'm back. And I found the graph I was thinking of. 
The CO2 part is Figure 3 from from http://earth.geology.yale.edu/~ajs/2001/Feb/qn020100182.pdf
However the temperature graph is pretty much crap, so I found http://math.ucr.edu/home/baez/temperature/ with lots of charts of interest, but the one covering the same time is http://math.ucr.edu/home/baez/temperature/4600Myr.jpg
It's hard to compare the CO2 with the temperature as they are, so I created this
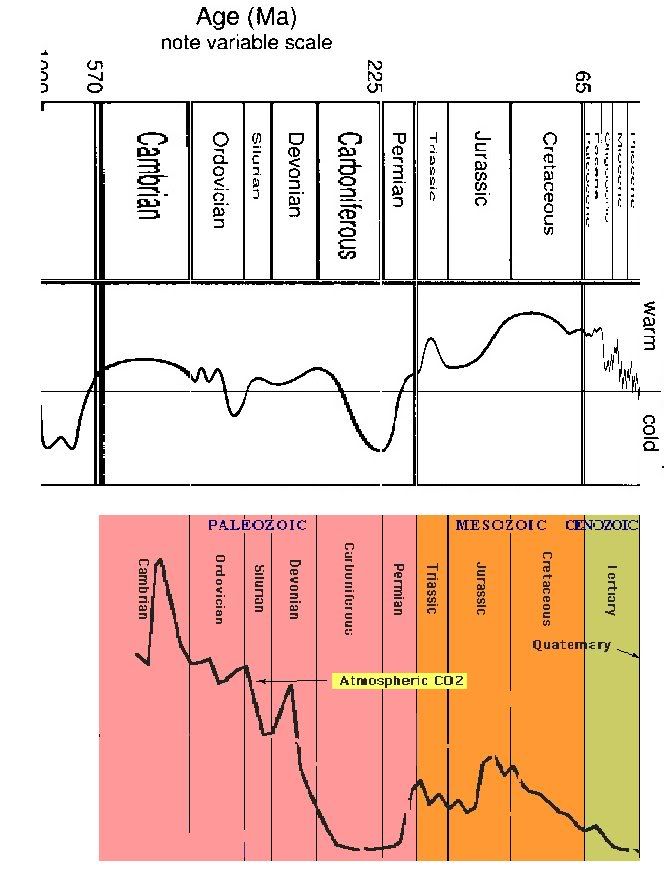
When you start to look further back, there's hardly any correlation at all.
As my last note on the topic, I found http://www.rightwingnews.com/mt331/2007/03/my_latest_townhall_column_10_q.php which asks 10 questions about manmade global warming. I am not claiming there is no global warming, I just can't find enough evidence to convince me that it's manmade.