Barkley said:
paulrage2 said:
24 million PS3s was sold at loss, the other 63 million was profitable. Sony also did a lot of money with games sold and PS Plus since 2010. Mark Cerny already said that PS4 would never happen if PS3 didn't maked success. WiiU was a total desaster.
|
The only success PS3 had is developing IP's like Uncharted and TLOU, maintaining a fanbase/userbase and pushing Sony's Bluray Format. Financially it was a disaster. During the PS3 generation PlayStation had an Operating LOSS of $3.59 Billion. They did make small profits towards the end with FY2010 and FY2011 but hardly could be called a lot of money. What is impressive is the profit in FY2018 alone wiped out 80% of the loss from the PS3 generation, and the PS4 generation will end with roughly a $9.5 Billion profit.
PS1 Generation : $3.42 Billion Profit (April 1st 1995 to March 31st 2000)
PS2 Generation : $2.39 Billion Profit (April 1st 2000 to March 31st 2006)
PS3 Generation : $3.59 Billion LOSS (April 1st 2006 to March 31st 2013)
PS4 Generation : $6.83 Billion Profit (April 1st 2013 to March 31st 2019)
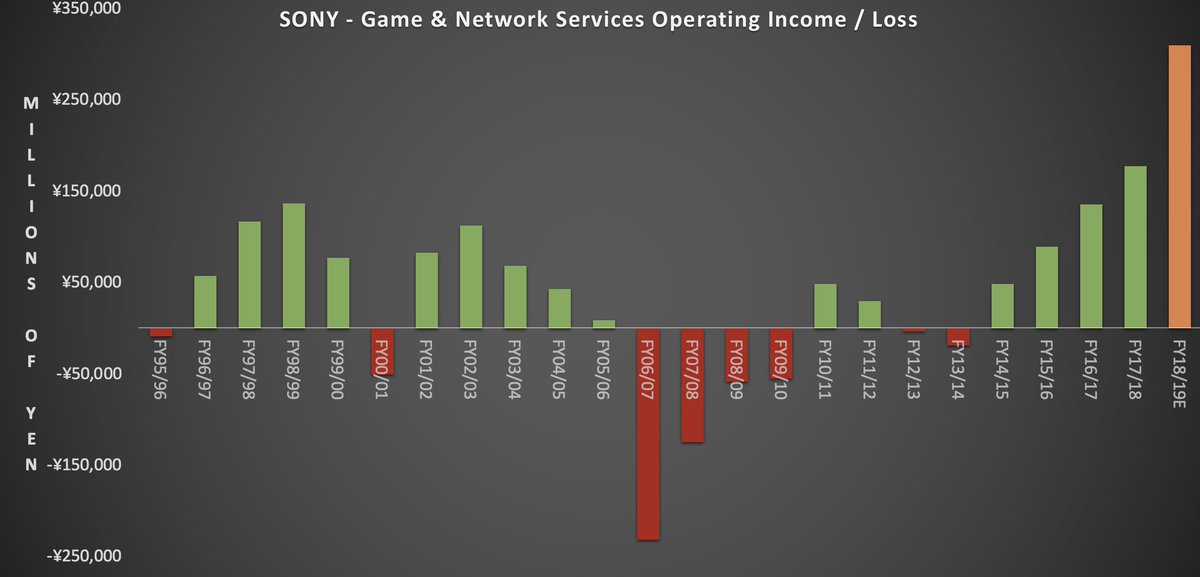
Sony Games & Network Services Operating Profit
FY1995 : -$0.08 Billion (April 1st 1995 to March 31st 1996)
FY1996 : +$0.51 Billion (April 1st 1996 to March 31st 1997)
FY1997 : +$1.05 Billion (April 1st 1997 to March 31st 1998)
FY1998 : +$1.24 Billion (April 1st 1998 to March 31st 1999)
FY1999 : +$0.70 Billion (April 1st 1999 to March 31st 2000)
FY2000 : -$0.47 Billion (April 1st 2000 to March 31st 2001)
FY2001 : +$0.75 Billion (April 1st 2001 to March 31st 2002)
FY2002 : +$1.02 Billion (April 1st 2002 to March 31st 2003)
FY2003 : +$0.62 Billion (April 1st 2003 to March 31st 2004)
FY2004 : +$0.39 Billion (April 1st 2004 to March 31st 2005)
FY2005 : +$0.08 Billion (April 1st 2005 to March 31st 2006)
FY2006 : -$2.11 Billion (April 1st 2006 to March 31st 2007)
FY2007 : -$1.13 Billion (April 1st 2007 to March 31st 2008)
FY2008 : -$0.53 Billion (April 1st 2008 to March 31st 2009)
FY2009 : -$0.50 Billion (April 1st 2009 to March 31st 2010)
FY2010 : +$0.44 Billion (April 1st 2010 to March 31st 2011)
FY2011 : +$0.27 Billion (April 1st 2011 to March 31st 2012)
FY2012 : -$0.03 Billion (April 1st 2012 to March 31st 2013)
FY2013 : -$0.17 Billion (April 1st 2013 to March 31st 2014)
FY2014 : +$0.44 Billion (April 1st 2014 to March 31st 2015)
FY2015 : +$0.82 Billion (April 1st 2015 to March 31st 2016)
FY2016 : +$1.25 Billion (April 1st 2016 to March 31st 2017)
FY2017 : +$1.62 Billion (April 1st 2017 to March 31st 2018)
FY2018 : +$2.87 Billion (April 1st 2018 to March 31st 2019)
|
While this is true every new generation, the end of the PS3 generation had much less profit in the most profitable years due to significant R&D to the Vita in 2011 and PS4 in 2013.
The PS1 gen only had to deal with the PS2 in FY00/01m and as clearly shown in the graph it appears that the PS2 made less profit than the PS1. But it also had significant R&D for 2 consoles in the PSP at 2004 and PS3 in 2006.
So while these numbers are quite factual, it doesn't mean that all losses can be directly attributed to a certain console.