freedquaker said:
There are all sorts of claim whether not machine is faster than the other. However, the truth is not always a straight answer, balck & white, usually shades of grey, depending on the circumstances. This was particularly the case with the 7th Generation but much less so in the 8th Gen. My comparisons below will NOT be technically precise but ROUGHLY ACCURATE. I will try to represent the rough performance indices with mathematical approximations and the associated graphs, based on the given premise.
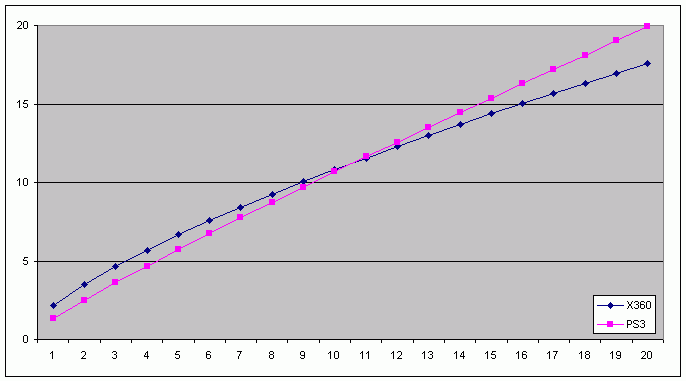
A) X360 vs PS3
1) X360 was easier to program for, and you'd get higher performance with unoptimized ports.
2) As a norm, third party games will exhibit higher SLIGHTLY higher performance on X360
3) With the given effort and higher costs, PS3 had the potential to exhibit considerably higher performance, usually utilized only by the first party titles, given the economic incentives and the lack of multi-platform development.
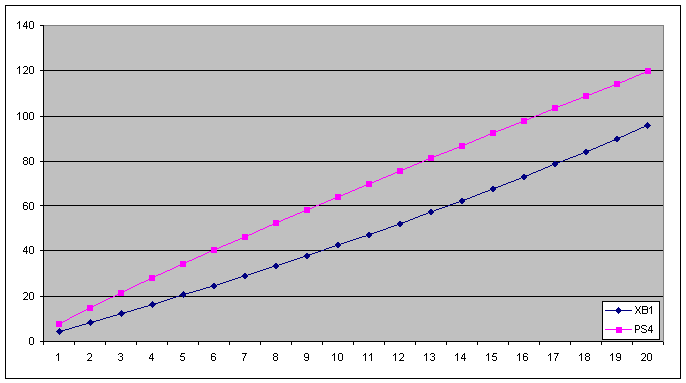
B) XB1 vs PS4
1) PS4 is not only easier to program for, but also maintains a perpetual significant performance advantage.
2) As a norm, third party games will exhibit SUBSTANTIALLY higher performance on PS4
3) With the first party titles, things are complicated. The increased effort & development will make it possible to achieve higher pixel fidelity and frame rate on XB1, which is otherwise not possible (narrowing down the gap). PS4 performance on first party titles will also be substantially higher. So technically speaking, the gap may very well widen. However, if XB1 can achieve pixel parity, the perceived visual gap may decrease, at least with first party titles.
Below is a table with regards to the PERCEIVED performance for each console with regards to the effort & development costs
|
Performance |
|
|
|
Performance |
|
| Effort/Cost |
X360 |
PS3 |
PS3/X360 |
|
Effort/Cost |
XB1 |
PS4 |
PS4/XB1 |
| 3 |
2.16 |
1.34 |
62.3% |
|
3 |
4.41 |
8.06 |
182.9% |
| 6 |
3.51 |
2.51 |
71.5% |
|
6 |
8.43 |
15.05 |
178.6% |
| 9 |
4.66 |
3.61 |
77.6% |
|
9 |
12.43 |
21.67 |
174.4% |
| 12 |
5.69 |
4.68 |
82.2% |
|
12 |
16.47 |
28.08 |
170.5% |
| 15 |
6.66 |
5.72 |
85.9% |
|
15 |
20.59 |
34.32 |
166.7% |
| 18 |
7.56 |
6.74 |
89.1% |
|
18 |
24.81 |
40.45 |
163.0% |
| 21 |
8.42 |
7.74 |
91.9% |
|
21 |
29.12 |
46.46 |
159.6% |
| 24 |
9.25 |
8.73 |
94.4% |
|
24 |
33.53 |
52.40 |
156.3% |
| 27 |
10.05 |
9.71 |
96.7% |
3rd Party Norm |
27 |
38.06 |
58.26 |
153.1% |
| 30 |
10.81 |
10.68 |
98.7% |
30 |
42.70 |
64.05 |
150.0% |
| 33 |
11.56 |
11.63 |
100.6% |
33 |
47.46 |
69.79 |
147.1% |
| 36 |
12.29 |
12.58 |
102.4% |
|
36 |
52.33 |
75.47 |
144.2% |
| 39 |
12.99 |
13.52 |
104.0% |
|
39 |
57.32 |
81.11 |
141.5% |
| 42 |
13.69 |
14.45 |
105.6% |
|
42 |
62.43 |
86.71 |
138.9% |
| 45 |
14.36 |
15.38 |
107.1% |
|
45 |
67.66 |
92.26 |
136.4% |
| 48 |
15.03 |
16.30 |
108.4% |
|
48 |
73.01 |
97.78 |
133.9% |
| 51 |
15.68 |
17.21 |
109.8% |
|
51 |
78.48 |
103.26 |
131.6% |
| 54 |
16.32 |
18.12 |
111.0% |
1st Party Norm |
54 |
84.07 |
108.71 |
129.3% |
| 57 |
16.95 |
19.02 |
112.2% |
57 |
89.78 |
114.13 |
127.1% |
| 60 |
17.57 |
19.92 |
113.4% |
60 |
95.62 |
119.52 |
125.0% |

|


