


Well, as here is a sales-site and the new gen has started with the first combatant (WiiU) I think it is time to work with numbers and create graphs. Yay!
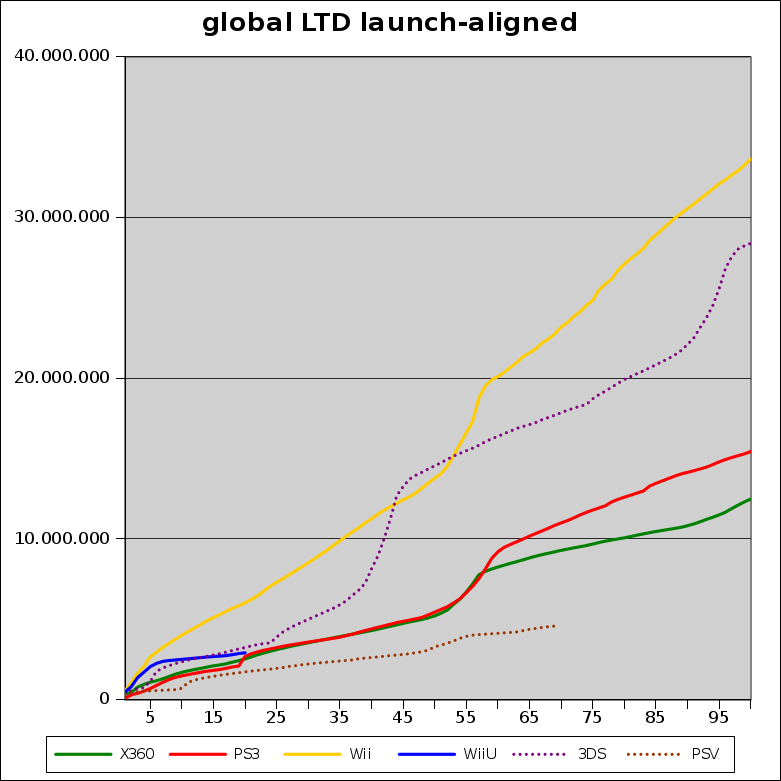
Well, global sales, the launch is aligned for each of the consoles. I have taken 100 weeks for the last gen from VGChartz and we can see how the WiiU is managing to hold itself against it. Note that PS3 launched later in Europe, this is clearly visible near week 20. Also the PS Vita had a later launch in europe and the US, also visible.
To get an even better picture, the weekly sales (Jan-Dec) of the first year of every console:
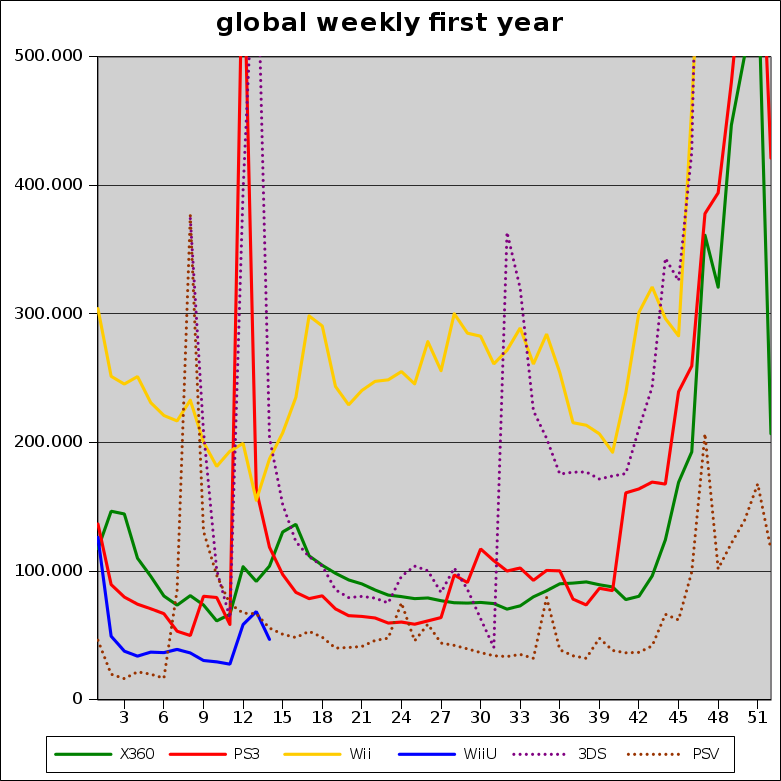
Again, notice the later european launch of the PS3 and the global launch of the PS Vita. Also the 3DS was launched early in the year, so I took that as first year.
At the moment the WiiU-sales are best comparable to PS Vita, that's why I have put up a gap-chart to track movement in this area. I may change the comparison in the gap-chart later, if other reference-consoles are more interesting as comparison.
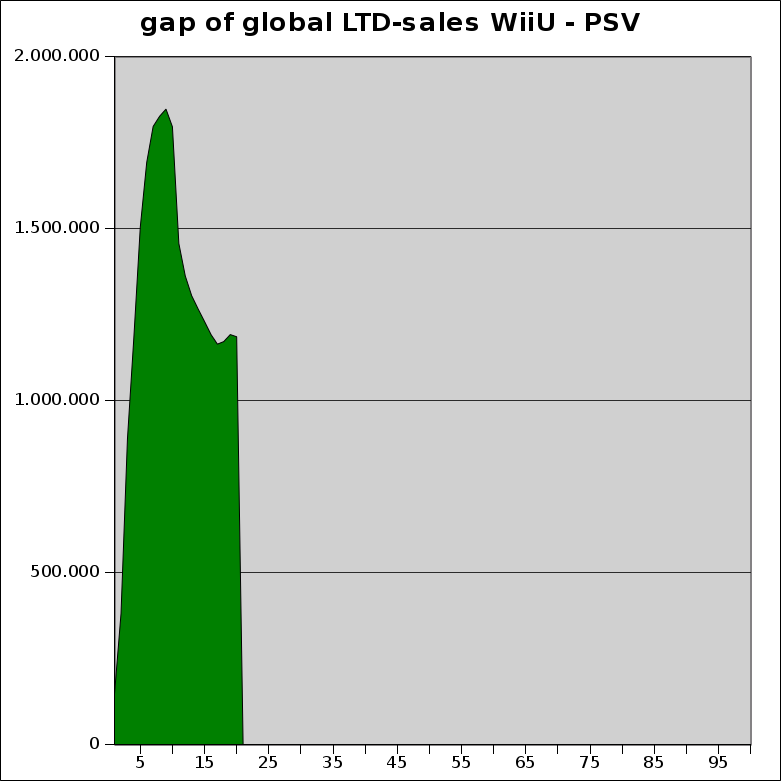
WiiU put up a lead at launch, but lost some of it as Vita released in US and europe.
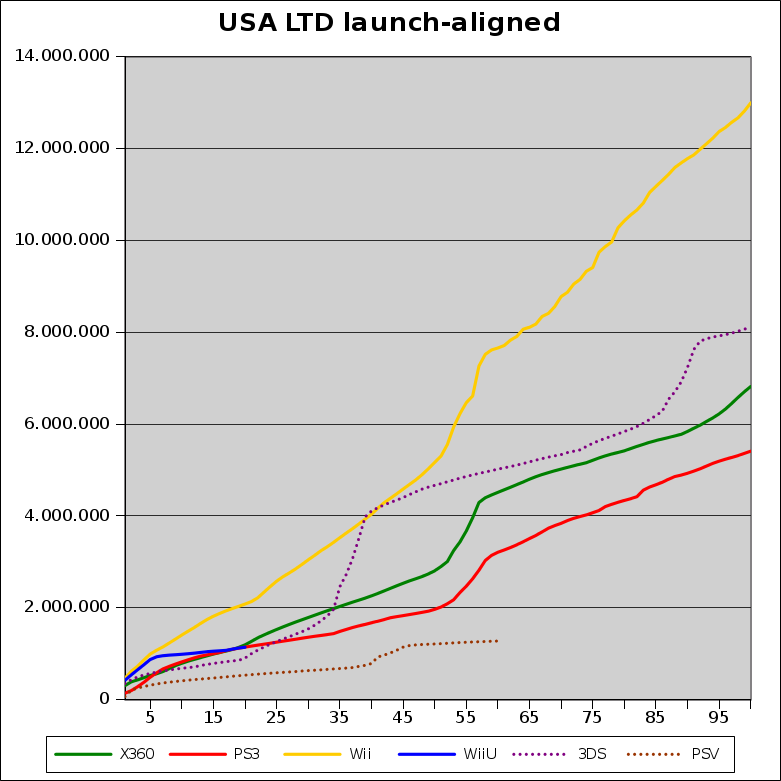
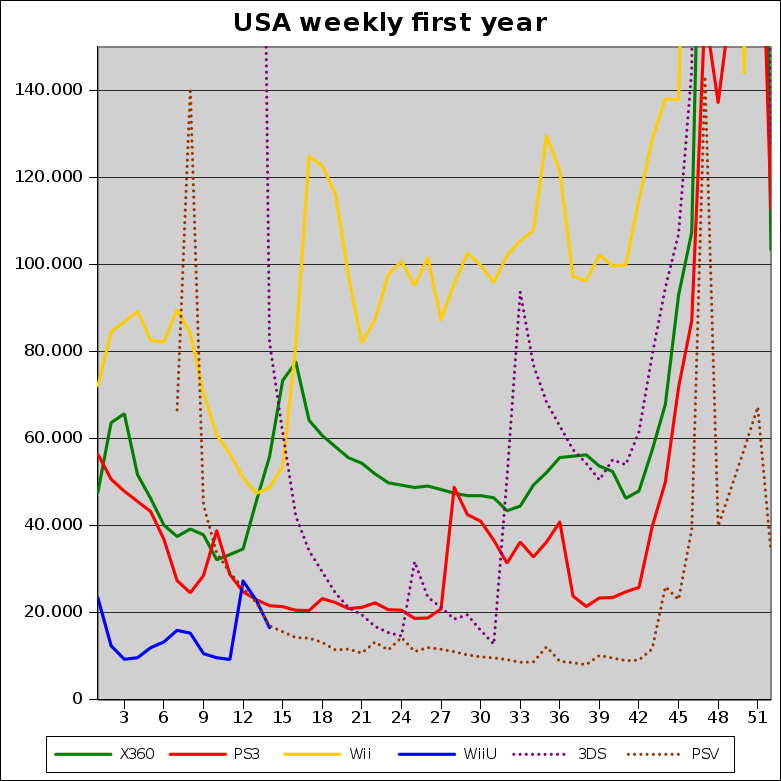
To get a better picture I also add the regions. It may take a while though, to collect the data for last-gen.
Starting off with the USA:
How will the WiiU go in the long-term?
Data: http://stuff.mnementh.de/vgchartz/ (use gnumeric to access it, it's free)
Take also a look on Superchunks thread. It makes similar comparisons but has different graphs and features tables.